PEG Ratios!
Post on: 10 Июнь, 2015 No Comment

The Fundamentals — Profit Earnings & Growth Ratios (PEG value)
I’m going to tie in the reason for fundamentals and how that fits in with technical analysis. It will all make perfect sense after you are done reading this part of the puzzle. Some ideas about the PEG ratio came to my mind after reading my friend’s Shane article (www.coveredcalls.com) on PEG which was coined by the two brothers at The Motley Crue with a web site under the same name and several books to their credits. So, I’m building upon Shane’s work. Like Shane’s covered calls data reports (www.coveredcalls.com) and our LEAPs spreads data reports, both report formats provide a reduce target list with applied mathematical screening criteria which must be further evaluated by the readers or users of that data. The advantage to this route to investing (and learning about it as a novice investor) is that along the way you will learn first hand to identify the technical analysis chart patterns that fairly accurately predict future moments along with supporting vital CANSLIM fundamentals.
I must stress that when you read and discover the status of the fundamentals which can be found on the internet at various locations like www.yahoo.com that you not toss out golden opportunities just because the fundamentals are bad or Declining. From this point forward, I ask that you simply place the stocks into two categories or mental list. In fact, maybe you should even write down the names. Stocks that are expected to go down and stocks that are expected to go up. The reason is simple. First, you just did some homework and that means you invested your time. Why not get something back from that time invested. Second, does the stock(s) you just reviewed for the fundamentals belong to some industry group that seems to indicate the same downward decay of fundamentals? Yes? That’s even better! Third, why are you and the majority of other so-call investors out there so fix and rigid in their minds about making money with stocks or industry groups that are declining? Fourth, you can make more money faster when stocks and industry groups take a turn for the worse. You can quote me on that! Stocks fall faster in price than they rise when they or the industry group are in an upward trend. There is no reason in the world why you could not be making money every day and week of the calendar year. Provided you brand into your mind to, let the trend be your friend!
In addition to the technical indicators presented in the WINs, careful fundamental research review is also a critical part of every successful position analysis BEFORE YOU INVEST. Though technical indicators like chart reading using indicators like the BB’s, RSI, and OBV can only tell you WHEN to invest in a position. (Example, extreme low RSI and lower BBs tags are bearish and may signal the bottoit’s the stock’s or industry groups basic current fundamental indicators that tell you exactly the WHAT to invest in with the appropriate investment instrument(s) or applied strategy and perhaps a close reversal point. See the WINs technical indicator matrix for the entire spectrum of signals.) It is the technical indicators that tell you WHEN to invest.
WHEN MAKING AN INVESTMENT DECISION
It is the technical indicators that tell you WHEN to invest. Because, technical indicators like chart reading using indicators like the BB’s, RSI, and OBV can only tell you WHEN to invest in a position.
It is the basic current fundamental indicators for a stock or industry group that will tell you exactly WHAT to invest in using the appropriate investment instrument(s) or applied strategy.
DO P/E RATIOS TODAY MAKE SENSE?
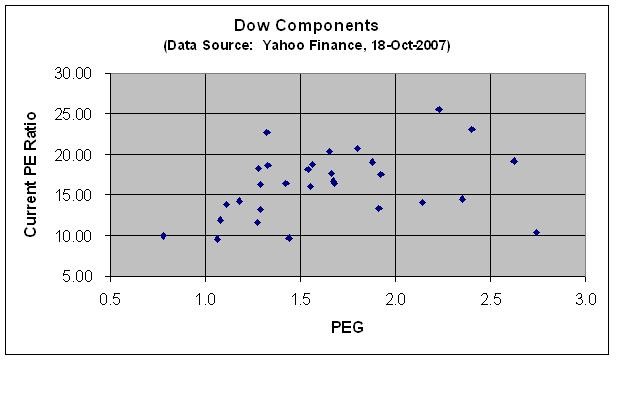
Most people are familiar with P/E ratios (price / earnings) and most quote sites on the internet provide a convenient P/E calculation with every stock quote. Traditionally, P/E ratios meant a great deal in the older economy dynamics. Along comes the internet and that P/E ratio becomes less of a calculating profit factor since profits can be made from nothing. That is, there is no bricks and mortar inventory like the old days. Along comes a lesser known fundamental indicator or measurement, and often times a far more important one, is what’s known as the PE/G ratio. This is a slight enhancement to the P/E ratio that also throws a company’s projected annual growth into the equation. The PE/G stands for P/E divided by Growth, most often meaning the company’s 1-year earnings growth rate.
What does the PE/G ratio tell us? The PE/G ratio is a measure of how much investors are paying for a potential future stream of earnings. This ratio is one way for investors to compare price to growth. For example:
Earn/Share: $0.62
P/E ratio: 29 (18.13 / 0.62)
Projected growth: 20%

(1-year earnings growth rate)
PEG ratio = 1.45 (29 / 20)
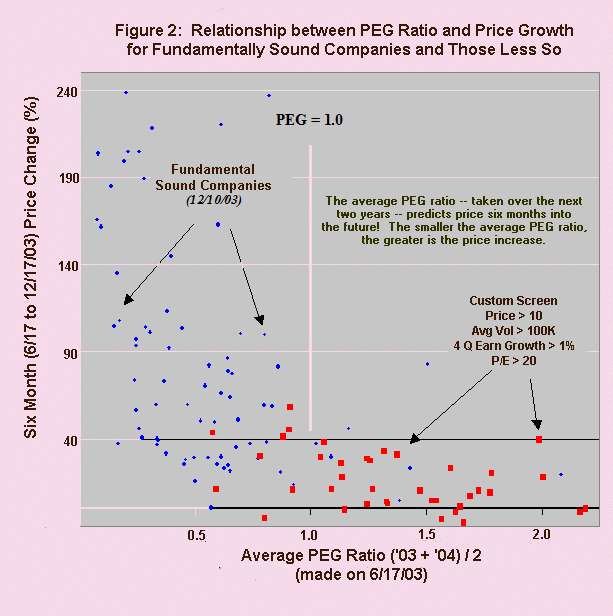
A PEG value of less than 1.0 implies that the stock may well be undervalued; more than 1.0 implies that it may be overvalued. In the March 2001 issue of Money magazine, their in-house market guru Michael Sivy suggests that you buy a stock when its PEG ratio is less than 1.5 (p. 72).
Michael Sivy also suggests that: PEGs also work best for firms with highly predictable core growth rates. In general, the ratio is more reliable for
Not many quote or research sites provide the PE/G ratio calculation when providing stock quotes. There are a few good stock screeners, however, that allow you to perform a full market screen based on the PEG ratio values that you specify. Following is a few of the stock screeners that we’ve turned up that provide access to the PEG ratio:
[Additional Research and Articles on PEG Ratios]


