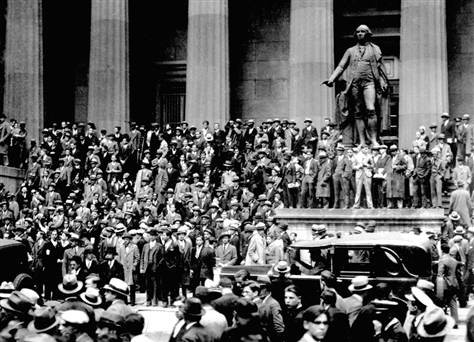
October Anniversary to The Worst Market Crashes in History
Post on: 6 Июль, 2015 No Comment

Now, before our dozens of readers freak out and hit that sell button, let’s put a long term lens to this and see how the markets have done since the worst market crash in history (19 October 1987). Below is the graph for the Dow Jones Industrial Index since the start of 1987 up till 20 October 2014.
Source: Google Finance
As we can see, that “worst market crash ever” ends up looking like a small blip on the far left of the chart. In fact, from the low of 1738.74 for the DJI on 19 October 1987, the index has contrived to rally 842% to its close last Friday a full 27 years later. In all, the DJI has risen an annualized 8.66% (excluding dividends) since from the bottom of the “Black Monday”.
At the local front, the level of returns from the DJI has been fairly close to the returns of the SPDR STI ETF (SGX:ES3). The STI ETF is a proxy for the market barometer, The Straits Times Index (SGX:^STI). Since its inception on 11 April 2002, the STI ETF has provided annualized returns of 8.39%.
Foolish Take away
Foolish investors may do best to always keep their eyes on the long term. After all, that could be where the best returns of the share market can be found. Individual investors might also want to take the wise words of Chief Executive Officer and co-founder of the Motley Fool, Tom Gardner to heart. As he once quipped :
“Stocks down for the day, week, month or year … well, what can I learn from that? When all is said and done, none of us will remember how our money did on any given day. We’ll even have trouble remembering our performance in any given year.
But from saving methodically and investing avidly, the odds are very high we’ll have increasing levels of financial independence such that we can live our days freely as we choose.”
With the Dow Jone Industrial’s long term chart in mind, it is unlikely that we will remember the occasional blemishes of the share market today when it could fade away to weight of long term investing success.
Learn more about investing and keep up to date with the latest stock market news and happenings! Sign up now for a FREE subscription to The Motley Fool’s weekly investing newsletter, Take Stock Singapor e. It will teach you how you can grow your wealth in the years ahead.
Like us on Facebook to follow our latest hot articles.
Get FREE Issues of TAKE STOCK
By submitting your email address, you consent to us keeping you informed about updates to our website and about other products and services that we think might interest you. You can unsubscribe at any time. Please read our Privacy Statement and Terms of Service .
The information provided is for general information purposes only and is not intended to be personalised investment or financial advice. Motley Fool Singapore contributor Chin Hui Leong doesn’t own shares in any companies mentioned.
Last night I came across an article describing some of the worst market crashes in the history of the US stock market. As it turns out, the month of October happens to be rife with the anniversaries of the some of the worst market share crashes ever recorded.
Below are the anniversary dates, and the recorded declines for two of the worst single-day crashes for the Dow Jones Industrial Index or DJI. The Dow Jones is one of the three major indexes the others being the S&P 500 and the NASDAQ which tracks the US stock market.


