MovingAverage Convergence
Post on: 16 Март, 2015 No Comment

MACD Definition
Moving-Average Convergence/Divergence Oscillator, commonly referred to as MACD indicator, is developed by Gerald Appel which is designed to reveal changes in the direction and strength of the trend by combining signals from three time series of moving average curves.
How to Use MACD Indicator
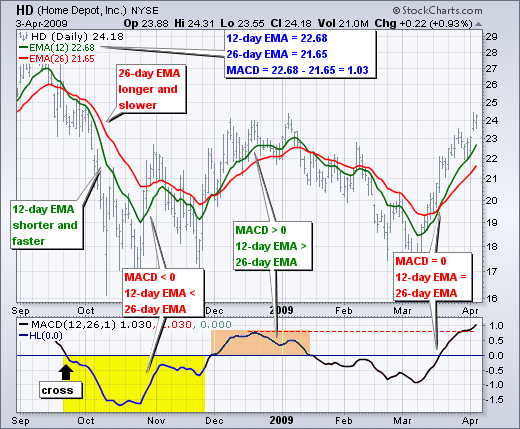
Three main signals generated by the MACD indicator (blue line) are crossovers with the signal line (red line), with the x-axis and divergence patterns.
Crossovers with the signal line:
- If the MACD line is rising faster than the Signal line and crosses it from below, the signal is interpreted as bullish and suggests acceleration of price growth;
- If the MACD line is falling faster than the Signal line and crosses it from above, the signal is interpreted as bearish and suggests extension of price losses;
Crossovers with the x-axis:
- A bullish signal appears if the MACD line climbs above zero;
- A bearish signal presents if the MACD line falls below zero.

Convergence/Divergence:
- If the MACD line is trending in the same direction as the price, the pattern is known as convergence, which confirms the price move;
- If they move in opposite directions, the pattern is divergence. For example, if the price reaches a new high, but the indicator does not, this may be a sign of further weakness.
MACD Indicator
MACD Trading Strategy
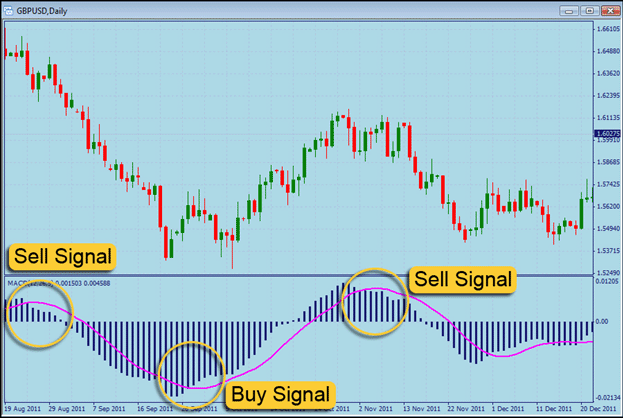
MACD strategy is used to determine the buy and sell signals for the financial instrument. The MACD values range above and below the zero line. When the MACD and Signal lines are far above the zero line, this shows an overbought condition and indicates a sell signal. When the two lines are well below the zero line, this shows an oversold condition and indicates a buy signal.
In the MACD system, it is very important to consider MACD histogram. The histogram includes vertical bars which show the difference between two MACD lines. It is above the zero line when the MACD lines are in positive alignment, meaning that the faster line is above the slower line. And when the histogram is above the zero line, but starts to move down toward the zero line, this indicates that the uptrend is weakening. Accordingly, when the histogram is below the zero line and starts to rise toward the zero line, this shows a weakness in a downtrend.
Signals are shown on the zero line crossings. Though buy or sell signals are generated only when the histogram crosses the zero line, the latter provides earlier warnings of the trend than the crossover signals. The histogram turns toward the zero line always precede the actual crossover signals.
MACD Indicator Formula (MACD Calculation)
MACD line = 12-period EMA – 26-period EMA
Signal line = 9-period EMA
Histogram = MACD line – Signal line


