Moving Averages_1
Post on: 16 Март, 2015 No Comment

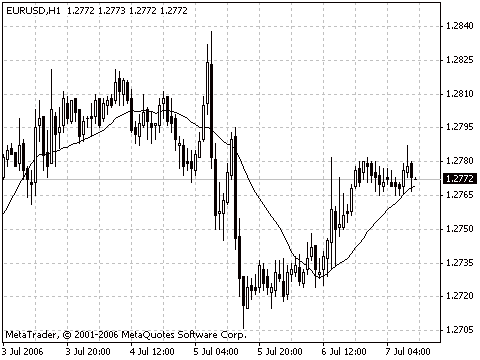
2fImages%2fStudyScreenshots%2fStudy-Thumbnails%2fMovingaverage2_jpg /% The moving average was likely the first technical study used by traders and investors to determine the trend of the market. The moving average smoothes price fluctuations by averaging a selected number of prices. This removes what engineers refer to as high-frequency noise from the data, and from the traders standpoint, the smoothing creates a study that can be used as a definition for the trend. The average price is plotted on the price chart along with the price bars. There are different ways to calculate the average price, including simple, exponential, weighted, and smoothed calculations. CQG carries two studies, the moving average and the moving average cross, both of which can be formatted to the traders interest and be a part of conditions, custom studies, alerts, and trading systems.
How the moving average has been used in the past:
Traders, investors, and analysts use the moving average in different ways. One long-term technique used by technicians is to track the 200-day moving average of a security. The 200-day moving average approximates the trend of the stock over a years worth of data. If the stock is trading above the 200-day moving average and the 200-day moving average is climbing, the trend is positive, as the stock has been rising for the last year. Analysts also track the price of the broad market indexes relative to their respective 200-day moving averages to gauge the overall trend of the market.
With CQG, you can scan a portfolio of stocks and create a list of bullish and bearish candidates for further study based on this 200-day moving average concept.
The more intermediate-term traders traditional use of the moving average is to look for a closing price above or below a moving average as a buy or sell signal. Often, the moving average was a 20-day moving average, which approximates one month of activity. This technique was popular among commodity traders looking for sustained trends in grains or other markets that had a tendency to trend when weather conditions created a potential for a poor harvest (resulting in a bull market) or an abundant harvest (resulting in a bear market). But for equity traders, sideways periods created many false signals and led to losses.
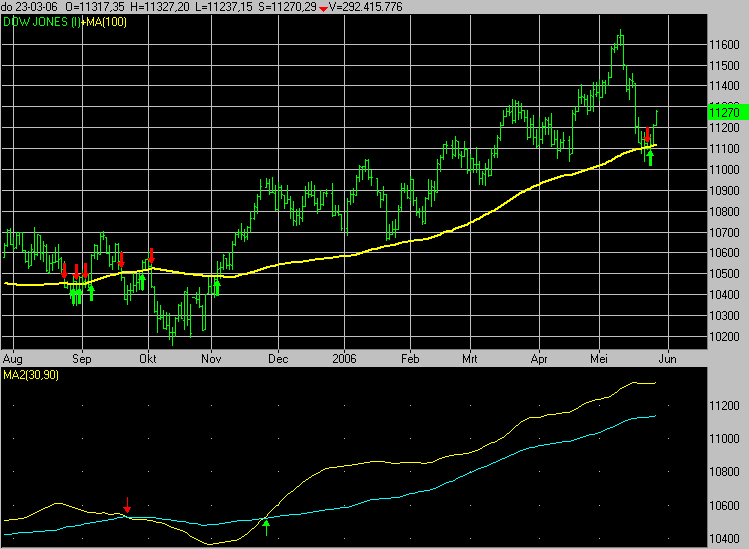
To reduce the whipsaw problem, traders incorporated a multiple moving average approach, called the moving average crossover. Up to three moving averages were used, with the two popular ones using similar lookback periods, four-, nine-, and 18-day moving averages, and five-, 10-, and 20-day moving averages.
Using three moving averages was the basis for more elaborate rules than just a simple closing price past the moving average concept. For example, if all three moving averages are rising and the four-day is leading the nine-day, then the market is in a strong uptrend. If all three moving averages are falling, with the four-day leading the nine-day down, then the market is in a very weak downtrend. But if the four-day moving average was below the nine-day moving average, and yet both the four-day and nine-day were above the 18-day moving average, then the market was in congestion with a bullish bias as the long-term moving average was still rising.
The problem with moving averages is that the computation creates a lagging indicator. The calculation always uses the current price and depending on the type of moving average being used, either historical prices are used or the previous value of the moving average is included. This historical look will dilute the impact the current price has on measuring the trend because there is a tradeoff between reducing noise and identifying a new trend. Some moving averages do a better job of reacting to the current price actions than others. To see why, a look at the formulas is in order.
The CQG moving average study plots the average price over a user-specified period in bars. Five methods of calculating the moving average are available in CQG: Simple, exponential, weighted, smoothed, and centered. First, here is an introduction to CQGs formula language.
In CQG, the symbol (@) is used for the current value. For example, Close(@) is the closing price for the current bar. If a study was summing the last three closing prices, the formula could look like this:
Close(@) + Close(@)[-1] + Close(@)[-2].
Close(@) is todays close, Close(@)[-1] is the previous bars close, and Close(@)[-2] is the close two bars ago.
Another example of the CQG formula language details how the lookback period appears. If we were creating a custom formula and the 14-bar relative strength index (RSI) study was used as one component, then the formula would include RSI(@,14) for the 14-bar RSI applied to the current series of bars. Here are the moving average studies available in CQG and some comments regarding their particular attributes. Each moving average is shown in Chart 1, so that you can see the attributes of each.
The formula for a five-day SMA is:
(Close(@) + Close(@)[-1] + Close(@)[-2] + Close(@)[-3] + Close(@)[-4]) / 5
Five closes starting with the current and working out to the close four days ago are summed and divided by five.
In this case, each closing price is weighted the same (1/5). Therefore, the close today has the same impact in the calculation as the close four days ago. If todays close was dramatically different from the close four days ago, perhaps from a breakout of a trading range, the SMA will lag the price action due to this equal weighting or equal importance of the individual closing prices over the past five days. The longer the lookback period is used, the more significant role this takes on.
Exponentially Smoothed Moving Average (ESMA)
An exponentially smoothed moving average (ESMA) uses just the current closing price, the previous value of the ESMA, and a smoothing constant (SC) for the calculation:
ESMA(@) = SC*Close(@) +((1-SC)*ESMA(@)[-1])
Todays ESMA is the sum of todays closing price multiplied by the smoothing constant and yesterdays ESMA multiplied by 1 minus the smoothing constant.
The smoothing constant can be any decimal number between zero and 1. Traders use a formula for the smoothing constant to approximate a simple moving average, 2/(n + 1) where n is the lookback period used in an SMA. If we set n = 5, then 2/(n+ 1) =2/6 = 0.3333. The formula for the five-day ESMA:
ESMA(@) = 0.3333*Close(@) +(1-0.3333)*ESMA(@)[-1]
To easily see how the formula for the smoothing constant approximates a simple moving average, consider that a one-day SMA is simply the closing price and if we use n = 1 in the ESMA, the smoothing constant is 2/(1+1) = 2/2 =1. The ESMA then is:
ESMA(@) = 1*Close(@) +(1-1)*ESMA(@)[-1]
ESMA(@) = 1*Close(@) +(0)*ESMA(@)[-1]
ESMA(@) = Close(@)
In addition, note that the ESMA is the sum of the adjusted current closing price and the adjusted previous ESMA. This leads to a change in direction immediately by the ESMA if the closing price is above or below the ESMA for the first time. In other words, the first day the close is above a falling ESMA will cause the ESMA to turn up on that day. The ESMA does not lag the change in the direction in the market the way an SMA can. Many times, an SMA will continue to trend in the same direction, depending on the closing prices in the lookback period despite the current closing price changing direction.

Weighted Moving Average
A weighted moving average places more importance on recent data and less on past data. A weighted moving average multiplies each close by a weight, which decreases through the lookback period, totals the weighted closes, and divides the total by the sum of the weights. The weighing is based on the number of days in the moving average.
For a five-day weighted moving average, the weight used to multiply the current close is 5, the previous days close is multiplied by 4, and so on out to the last close in the window, which is multiplied by 1. This gives five times more weight to today’s price than the price five days ago.
This sum is then divided by the total of the weight multipliers (5+4+3+2+1, or 15).
The formula for a five-bar weighted moving average:
((Close(@)*5 + (Close(@)[-1]*4) + (Close(@)[-2]*3) + (Close(@)[-3]*2) + (Close (@)[-4]*1))/15
The weighted moving average is very responsive to the current price action due to the higher weighting placed on the current close relative to the previous closes in the lookback period. If the market is trending sharply in one direction, the weighted moving average will track the market price action in a closer manner than the SMA or ESMA.
A smoothed moving average, referred to as Smooth, uses the current closing price added to the difference of the previous sum of closing prices in the lookback period minus the previous simple moving average value, and divided by the number of bars in the lookback period.
For example, the formula for a five-day smoothed moving average is:
Smooth = (Close(@) + ((Sum(Close(@),5)[-1] MA(Close(@),5)[-1]))/5
The formula for the five-day smoothed average shows that the elements in the numerator are divided by 5, or each element is weighted by 1/5. On a percentage basis, this means each element contributes just 20% to the calculation. Therefore, the longer the lookback period, the smaller the individual weighting, and the slower the smoothed moving average will respond to the price action. A 20-day smoothed moving average weights each element by 5%.
Centered Average
A centered average is calculated the same as the simple moving average, except the first point of the centered average is plotted at the center bar of the specified lookback period.
For example, the first point for a five-bar centered average would be plotted at the third bar back. In the case of a centered average with an even number for the lookback period, the first point would be plotted at the bar immediately to the right of the center bar.


