Momentum Stock Trading
Post on: 2 Июль, 2015 No Comment

Trading individual stocks on momentum is a method that is old as the markets itself. While the idea is easy to understand, the mechanics of trading momentum stocks isn’t as easy as the concept presents itself to be. We’ll make sense of it all below:
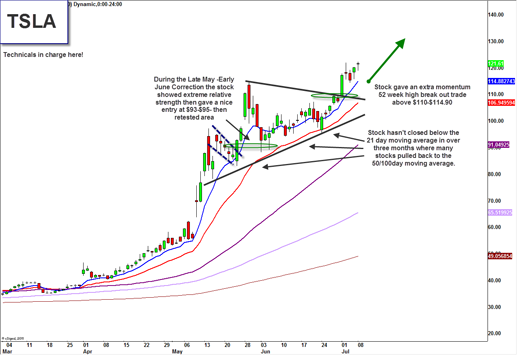
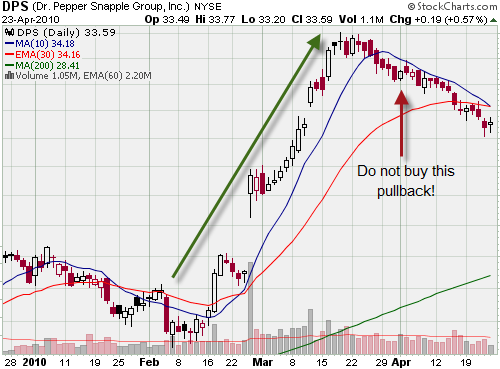
Trading with momentum means buying or selling stocks that have a very clear trend to the upside or downside. While it is usually the case that momentum investors buy or sell based on a continuation of an already existing trend, momentum traders can also make money on stocks that are running out of momentum and are expected to reverse.
Indicators for Momentum Stock Trading
Almost all momentum traders rely on either technical analysis of the stock charts, or price action to determine when to enter or exit a trade.
In terms of technical analysis indicators, the oscillators are most commonly employed by momentum traders. These include the relative strength index, MACD, CCI, or any number of other indicators that rise and fall based on price action, the definition of what a oscillator indicator is.
We’ll use a brief example that centers around the relative strength index. A momentum trader may be either a bullish or bearish trader, and may trade with or against the trend. The RSI is said to show that a security is oversold when it reads below 30. When above 70, the RSI shows that a particularly security is overbought, and thus traders should expect future share price decline.
Alternatively, momentum traders may look for what is known as “divergence,” or divergence in trend between the price and the RSI. If, for example, a stock is in a clear uptrend, but recently the RSI has been trending downward, then there exists negative divergence, and the stock price should soon head the direction of the RSI…down. If instead the price of a stock is dropping, but the RSI is making higher lows with each lower low of the stock price, then the price of the stock should soon rise.
Divergence is one of the most powerful momentum trading strategies when the RSI and price are at two extremes of the visible chart. That is, a divergence in price and RSI reading that indicates a sell is more likely to be accurate if both the price and RSI are at relative highs. If bullish divergence happens when the RSI and stock price are at relative lows, then it is likely that the current “buy” signal will prove to be profitable.

Price Action and Candlesticks
Momentum traders may also employ price action strategies to identify new and upcoming trends that are signaled as a result of a change in the current price action. One common method uses candlestick analysis and seek gaps at important trading times.
For example: if the market open for a particular stock, security, or commodity is met with a gap between the current price and the closing price of the last candle, then it should be clear that momentum will continue the trend. Thus, if a candlestick shows the last close was $25 per share, and the first open of a new candle shows a jump to $25.10, then momentum should carry the stock higher.
Gaps are important because they show an area where there were no sellers, thus prices rose considerably to meet a new area. They also show that (depending on the direction) a large share purchase or sale was made in market order fashion.
If the price of an example stock were to go from $20 to $20.50 in between two candlesticks, then it can be said that a large market order for shares was placed, or that there were not a sufficient number of sellers to fill the void in that area, thus the price is likely to continue higher until ample sellers are found to fill the purchase orders of new investors.


