Measuring Market Sentiment
Post on: 16 Март, 2015 No Comment

The measurement of market or investor sentiment is based upon two behavioural finance assumptions:
1. Investors are subject to emotion based on their expectations regarding future cash flows and investment risks that are not justified by current facts;
2. Betting against emotional investors is costly and risky. The history books are full of market events that were sustained by investor sentiment which pushed prices far beyond fair valuation – the 1970’s Nifty Fifty, Black Monday crash of October 1987, dot.com bubble of the 1990’s.
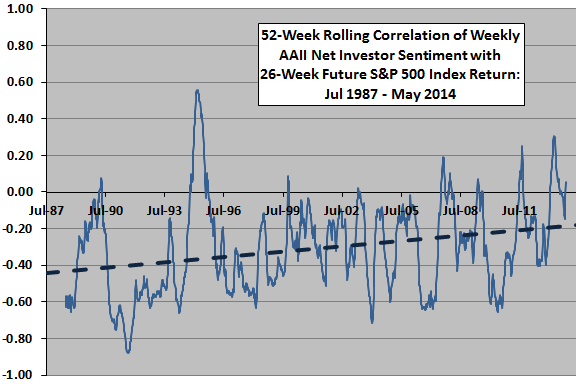
Real investors and markets are too complicated to be summarised by direct measures e.g. investor surveys but overall market sentiment can be determined indirectly by observing what investors do rather than what they say. There is academic evidence that market sentiment levels are strongly correlated with near term market returns. Specifically, changes in market sentiment lead to changes in volatility and future returns. It is because of this correlated relationship that analysts are interested in determining market or investor sentiment as a gauge of future direction of market prices.
Over time, various tools and methods have been developed to assess market sentiment and some companies have created proprietary indices to provide continuous and comparable data on market sentiment e.g. the Investor’s Intelligence sentiment index. Typically, investors use such indices to identify turning points in markets which usually occur at sentiment extremes.
Each market has its own set of tools to identify market sentiment for example equity market sentiment can be gauged from:
Equity options put/call ratio. The Chicago Board of Options Exchange (CBOE) publish a put/call options ratio. When this ratio is high, speculation in equity put options is high and signals that investors are bearish and betting on prices falling. When the ratio is low, speculative activity in equity call options is high and therefore signals bullish sentiment. When a market gets too bullish or bearish conditions become ripe for a reversal in prices.

Volatility indices. there are many volatility indices available which are calculated from the 30 day implied volatility of options on the underlying market e.g. the S&P 500 equity index. Such a volatility index, often referred to as a fear index, provides a measure of investor’s expectations of volatility in the underlying market over the next 30 days. High volatility index readings are associated with investor expectations of a large movement in the underlying market – either up or down. When investors see markets as stable, low risk and unlikely to move sharply in any direction, then volatility index readings are low.
New highs versus new lows. this breadth indicator looks at the stocks in a particular index and counts how many are making new highs or new lows. During a market rally, a rising number of stocks making new highs shows that the markets advance is broadly based and therefore sustainable. An advance based on a small number of stocks making new highs, is considered unlikely to last. Conversely, during a decline the number of stocks making new lows provides information on the likely duration of falling prices.
Advance / Decline Ratio. this is also a breadth indicator and measures the number of stocks on any day that rise in price (advance) versus those that fall in price (decline). The underlying tenet is that this ratio evaluates the rate of money entering or leaving the equity market and is able to indicate overbought and oversold extremes where a reversal in the direction of market prices is expected. The McClellan Oscillator is a derivative of this ratio where a reading above zero is considered to indicate bullish market sentiment and a reading below zero indicates bearish market sentiment.
These are just a few of the tools used by technical analysts to determine equity market sentiment and each market has its own set of sentiment tools. In particular, the explosive growth in derivatives markets means that there are now many different types of volatility indices calculated for varying markets e.g. equity indices, oil, gold, fixed income and forex which provide a useful measure of market sentiment.


