Market Risk Beta
Post on: 23 Июнь, 2015 No Comment

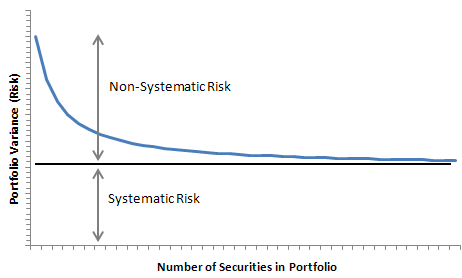
Market risk is measured by beta, which is another measure of investment risk that is based on the volatility of returns. In contrast to standard deviation, beta measures volatility relative to a relevant baseline rather than to the mean of the asset that is being evaluated. Beta is the appropriate measure of an asset’s contribution to your portfolio’s risk, as it measures only systematic risk, i.e. market risk.
You should recall that the standard form of the equation of the regression line is Y = a + bX. When you regress one asset on another asset or a benchmark index, the slope of the regression line, b, is referred to as the dependent variable’s beta and it describes the movement of the asset (the dependent variable) relative to its benchmark (the independent variable). In the regression example, a large-cap growth fund was regressed on the S&P 500 which yielded the regression equation Y = 3.25 + 1.23(X), where Y is the estimated return of the growth fund given the return on the S&P 500 = X.
Here’s a more detailed computation of beta using 10 years of monthly returns:
This computation yields the regression equation Y = 0.003 + 1.208(X). So, based on the monthly data, the growth fund’s beta is 1.2, which tells us that for every 1% move in the S&P 500 the growth fund can be expected to move approximately 1.2% in the same direction. The market’s beta is by definition 1.0 and it is the baseline market risk. The risk-free asset’s beta is by definition zero.
In this example, there is very little dispersion of the data points with respect to the regression line. This is to be expected, as the dependent variable, being a large-cap fund, should be very highly correlated with the S&P 500 and it is a well-diversified portfolio. If we did the same exercise with an individual large-cap stock, the data points would probably be much more dispersed. Also, the individual stock’s market risk, beta, could be considerably higher or lower than 1.0, depending on the nature of the firm.
Beta is a commonly published statistic that you can use to evaluate the market risk of assets that you are considering adding to your portfolio. However, betas are usually derived using the S&P 500 as a baseline, which is fine if you’re evaluating large-cap domestic stocks or if you want to see how any particular asset moves relative to the S&P 500. Just keep in mind that betas thus derived are relative to the S&P 500 and that they only represent the residual volatility.

Portfolio betas are calculated as the weighted average of the betas of the assets that comprise the portfolios. If your universe extends well beyond the S&P 500, to get a truly relevant portfolio beta, the individual asset’s betas would have to be derived using a baseline that is representative of the assets in the portfolio, i.e. the market risk of your universe is still 1.0 by definition but it may be more or less volatile than the S&P 500. For a broadly diversified portfolio, this would entail developing a weighted average index of the appropriate indexes. I’m not suggesting that you need to do this, I’m merely making the point. Portfolio standard deviation is all you need to estimate your portfolio’s probable variability.
As beta is a measure of risk, it can be related to standard deviation. Indeed, an asset’s beta is equal to the product of its correlation coefficient, R, and its standard deviation divided by the market’s standard deviation. Mathematically, the correlation coefficient divided by the market’s standard deviation factors the specific risk out of the asset’s standard deviation leaving only the systematic risk, which, as you now know, is the market risk of the asset.
1 2 3 4 5 6 7 8 9 10 11 12 13 14
Section Intro Next Section


