MACD Stock Trading
Post on: 16 Март, 2015 No Comment

exacttrades January 11, 2012 0
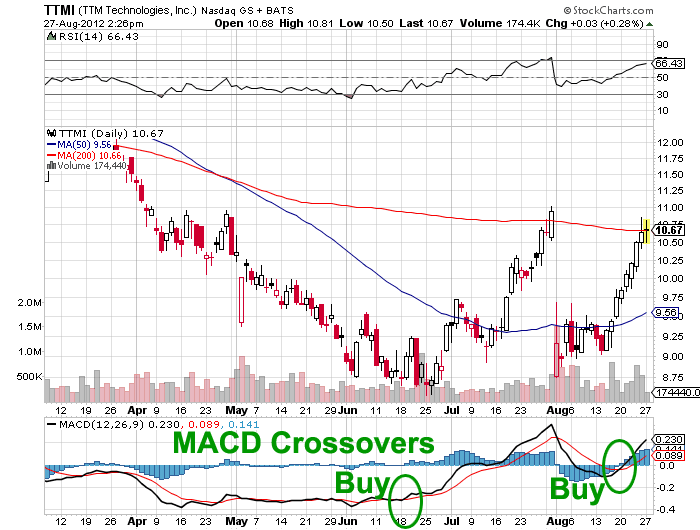
Before we begin looking into how we can trade the MACD lets explain what exactly it is. Developed in 1979 by Gerald Appel, MACD stands for moving average convergence/divergence. It is a technical indicator that calculates the difference between 2 different exponential moving averages over time. Divergence is when the distance between the exponential moving averages increases and convergence is when the distance between the exponential moving averages decreases. The divergence and convergence of the two EMAs (exponential moving averages) is plotted on the chart (usually in a window below price) as a bar graph histogram overlaid by the 2 EMAs. This information can be used to identify changes in price direction. For a video example of using a MACD on your chart click here.
HOW TO USE THE MACD
First of all, we believe that MACDu can be a valuable tool in your traders tool box but its our recommendation that you use it in addition to other trading signals such as trendlines, previous support & resistance levels and volume. You may be able to develop a profitable trading strategy using the MACD but by bundling it with other technical indicators you can really start to have a highly profitable and consistent trading system. One way to trade using the MACD is to trade the crossover from convergence to divergence.
MACD STOCK TRADING STRATEGY
When trading the MACD crossover we are looking for a larger than normal price move that we will then reverse in the opposite direction. So if the MACD emas are at the top of their channel and are about to crossover near the top we will be looking to enter in the short trade. Vice-versa if we have a large move down we will be looking for both EMAs in the MACD histogram to be crossing over on their way up from the lows and we will be looking to enter the long trade. You will then hold the position until you get a crossover in the MACD in the opposite direction. Now the key is this.
Remember earlier when we recommended combining the MACD with other technical analysis tools? Well before you go jumping into any MACD reversal the very first thing youll want to check is to see how much money is in the trade. Were talking about risk vs. reward here. How do we calculate risk vs. reward you ask? The fastest way is to look at historical prices for highs, lows and areas of consolidation. So if the price of a stock has dropped 10% and the previous low is approximately 5% from the current price you will be looking to get around 4% to 5% profit on this trade before it will begin to come into an area where we last had sellers (resistance). So we have our reward value of approximately 5%.
Now we need to find our risk. Our risk is calculated by finding the difference between our entry for the long trade and the lowest support for the day. Its very common for you to be about 1% off the bottom by the time you get your MACD crossover signal to enter long. So youll want to have your stop order placed below that low giving you a risk of approximately 1%. So now we have our R/R ratio. In this trade we are looking to take a trade where we have a 5 to 1 risk vs. reward ratio.
FINAL THOUGHTS
MACD stock trading can be a very powerful tool for traders, especially when combined with other forms of technical analysis. Play with the settings and apply it to different stocks to see which ones out perform the others. You may put together a basket of stocks that work best when trading your MACD crossover strategy and you might try looking at applying it to different time frames. Best of luck with your trading and well see you in the trenches.


