MACD Indicator Explained – What is the MACD Indicator
Post on: 17 Май, 2015 No Comment

Updated: May 14, 2013 at 8:39 AM
The “Moving Average Divergence-Convergence”, or “MACD”, indicator is a member of the “oscillator” family of technical indicators. Gerald Appel, a stock analyst in New York, created it. It is also described as a “lagging” indicator since it was designed to confirm a stock trend after it had formed using a combination of exponentially smoothed moving averages.
Although originally developed for use with stocks, the MACD oscillator is a common tool utilized in many markets, including forex trading. Trading signals are generated when various MACD crossovers occur and by MACD divergence. The technical MACD definition includes the computation of three moving averages, but only two lines are displayed “oscillating” about a “zero” line.
MACD Formula
The MACD indicator is now a common standard on most all software trading platforms. The MACD calculation involves the following computations:
Exponential Moving Average #1 (EMA1) – Choose Longer Period
Exponential Moving Average #2 (EMA2) – Choose Shorter Period
Calculate the Difference (DIFF) between EMA1 and EMA2
Calculate EMA3 from DIFF – Choose a desired period
Plot EMA3 versus DIFF about a center “zero” line
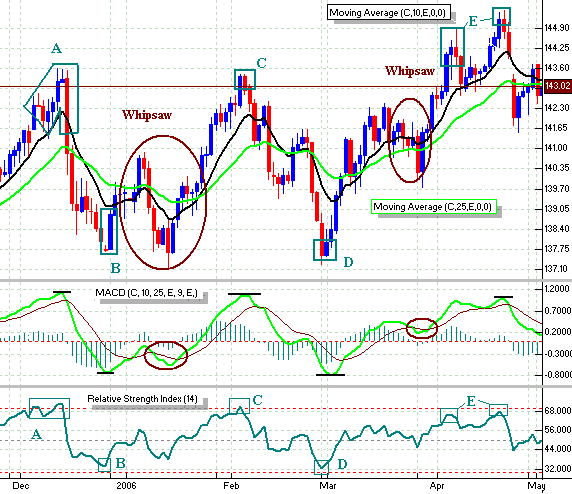
Software programs perform the necessary computational work and produce an MACD indicator as displayed in the bottom portion of the following chart:
The MACD indicator will typically have two lines of differing colors, accompanied by a dotted centerline. For visual purposes, the “signal” line may be one color while the other line is dotted or represented by “bars” as shown above. The centerline has a “zero” value and represents when the values of the two moving average are identical. Although there are three moving averages involved in the MACD calculation, there will only be two lines displayed, one moving obviously more slowly than the other. MACD period settings are changeable and can be customized to fit the trader’s tastes, but the typical settings are 26, 12, and 9, the period for the “signal” line, “EMA3”.
The chart displayed above is sometimes referred to as a “histogram” chart. A “Histogram” is a method often used to represent frequency distributions by means of a series of rectangles. This method allows for the eye to follow various crossovers and divergences in a much easier way.
Risk Statement: Trading Foreign Exchange on margin carries a high level of risk and may not be suitable for all investors. The possibility exists that you could lose more than your initial deposit. The high degree of leverage can work against you as well as for you.


