Looking At Financial Ratios To Analyse Performance Finance Essay
Post on: 30 Июль, 2015 No Comment

In nowadays environment, financial report and ratio analysis statement has become a guide for stakeholder and shareholder on their decision-making on investing a company. Financial report is the statement of the company profit and loss and financial ratio analysis is “the tools that’s indicating whether the organization is geared to operate efficiently and profitably (Prabir DAS).” By using ratio analysis, organization or company will able to analyze the failure of the business and find the way to improve it. Besides that’s, it also provide all-important of the early warning indications that allow organization to solve their business problem before the business is destroyed by others. The ratio analysis also helps the organization to forecast the future trends and predict future bankruptcy. There is five main’s ratio analysis to calculate or list down the profitability and the performance of the company, there are liquidity ratio, investment/ shareholder ratio, financial gearing ratio, profitability ratio, and financial efficiency ratio.
Liquidity ratio is the ratio that calculates the company’s ability on turning their asset into cash or the ability to pay. This ratio will help organization to measure the business’ financial strength. There are two type of liquidity ratio; there are current ratio and quick ratio, it is refer as decisive test ratio.
Current ratio is the measurement of current asset divided by current liability, and it can be refer as the measurement of company’s financial strength.
Current ratio formula:
When the current ratio is high, it is mean the company has high ability to change their asset into cash when they need to clear their debts.
Quick ratio is “the measurement of the amount of liquid asset that’s available to meet obligations” (Prabir DAS). Stocks excluded in this ratio because it is illiquid asset. This ratio is to measure the ability of the company on paying without any rely on stock.
Quick ratio formula:
Investment ratio
This ratio is the most important for the company to show investor the value of their company and the benefit the will bring to their shareholder. By investigating, the ratios, the stakeholder will able, to analyze the future worth of the investment reflected in the market value of shares. There are three kind of calculation on investment ratio and there are Earning Per Share (EPS), Price Earning Ratio (PER) and Dividend Yield.
According to invetopedia.com, Earning Per Share (EPS) is defining as “…the portion of a company’s profit allocated to each outstanding share of common stock…” In another words, EPS has used to measure the owner return or the profit that they can earn on every dollars they invest. Besides that, EPS is the indicator of the company’s profitability and a major component used in calculating the Price Earning Ratio.
Earning Per Share Formula:
Price Earning Ratio is the measurement of determine how much does investor or shareholder willing to pay on stock relative to the company earning. When the ratio is high, its mean the investor need to pay more for earning profit from the company.
Price Earning Ratio Formula:
According to invetopedia.com, Dividend Yield is “…the financial ratio show how much a company pays out in dividend each year relative to its share price…” The dividend yield in also can be refer to the return on investment for a stock.
Dividend Yield formula:
Gearing ratio
Gearing ratio refer to the level of the debt. Gearing is a measure of financial leverage, demonstrating the degree to which a firm’s activities are funded by owner’s funds versus creditor’s funds. (Investopedia 2010)
Gearing ratio formula:
Gearing ratio =
Gearing ratio getting higher means more the business is exposed to the fluctuation of interest rate and company has to pay back the interest and loans from being able to re-invest their earning.
Profitability
Profitability ratios provide information about management’s performance in using the resources of the firm. (Bangs, David H. Jr. 1992) Profitability measures look at the potential of the firm generates profit from sales or from its capital assets. For this, it has different measures of profit, which are gross profit and net profit. Gross profit is a firm’s residual profit after selling a product or service and deducting the cost associated with its production and sale. (Investopedia 2010) Net profit is also called ‘net income’. It is a firm is total earning.
Return on asset
Return on equity
Gross profit margin
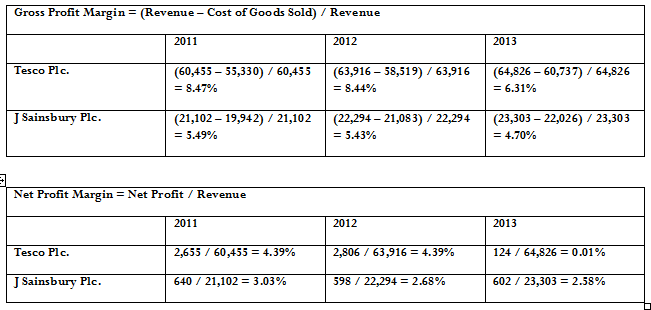
Gross profit margin is also referring as ‘gross margin’. It is a financial metric used to assess a firm’s financial health by revealing the proportion of money left over from revenues after accounting for the cost of goods sold. (Investopedia 2010) Gross profit margin serves as the source for paying additional expenses and future savings. (Investopedia 2010)
Gross profit margin =
Net profit margin
Net profit margin shows how much net profit is derived from every dollar of total sales. (Russell Wyrick 2008) It indicates how well the business has managed its operating expenses. It also can indicate whether the business is generating enough sales volume to cover minimum fixed costs and still left an acceptable profit. (Russell Wyrick 2008)
Net profit margin =
Return On Capital Employed
Return on capital employed is a ratio that indicates the efficiency and profitability of a firm’s capital investments. (Investopedia 2010) It should always be higher than the rate at which the firm borrows; otherwise, any increase in borrowing will reduce shareholders’ earnings. (Investopedia 2010)
ROCE =
Return On Asset
Return on asset is an indicator of how profitable a firm is relative to its total assets. (Investopedia 2010) It gives an idea on how efficient management is by using its assets to generate earnings. (Investopedia 2010) This is calculated by dividing a firm’s annual earnings by its total assets, which is displayed as a percentage. (Investopedia 2010)


