LongTerm Stock Investors Should Watch Index Trends
Post on: 30 Май, 2015 No Comment

Daily Movements Can Obscure Long-Term Trends
You can opt-out at any time.
Please refer to our privacy policy for contact information.
The major stock market indexes track the movement of investor dollars into and out of the market. They are also followed much too closely by many investors.
The indexes rise and fall on good news and bad. For long-term investors, they provide market direction when you look at trends over time.
Traders who try to time the market are much more concerned with the day-to-day or minute-to-minute changes.
Long-term investors can use one or more of the indexes to compare how individual investments are doing over time, but first it helps to understand what they measure.
An index is a mathematical concept that is used to measure the change in a particular set of numbers. To use an index, you start with a base number (each index does it a little differently) and that base number represents the value of the set of numbers you are following.
As the numbers change in value, the base number changes and it is that change that is the index. The index number itself usually may have no direct meaning relative to the numbers it is tracking; what is important is the change in the index. This change reveals the collective change in the underlying numbers.
In the case of the stock market, we use indexes to tell us whether there are more buyers or sellers at a given point in time of a segment or the whole market.
Some indexes are used as indicators of the whole market, while others represent segments of the market. There are three major market indexes that the media reports every day the market is open. They are:
- The Dow Jones Industrial Average (the Dow)
- The S&P 500
- The Nasdaq Composite
There are many other indexes, but these three gain the most attention because they are considered the most important in gauging the overall condition of their respective markets.
Most days you will notice the Dow and S&P 500 moving the same direction and at about the same rate or percentage up or down. The Nasdaq, however, follows its own path due to the different size companies represented in the index, although it often tracks closely with the other two indexes.

The Dow
The Dow is the oldest of the indexes and the most widely known index in the world. The Dow contains just 30 companies; however, they are some of the most prestigious companies in America. Together, they make up 27 percent of the total market, so they do have considerable influence.
The Dow is considered by many the market proxy, and if it lacks the breadth of coverage to legitimately earn that title, it certainly owns the emotional crown. Despite its well-earned reputation, the Dow does not include any smaller companies, which make up the bulk of companies in the market.
The Dow began as a simple average of the price of all the stocks in the index; however, it has changed over the years. It is the only index that is price weighted. This means if a $25 stock increases in value by $2, it has the same effect on the index as a $50 stock that increases $2, even though the lower-priced stock had a larger percentage change in price.
The S&P 500
The S&P 500 is compiled by the Standard & Poor’s company and includes 500 of the leading and largest companies in the market. Although it is not made up exclusively of large companies (the index looks to include companies it considers leaders in their industries), it is heavily weighted that way.
The index covers some 70 percent of the total market’s value, so it is more representative than the Dow is in that sense. The S&P 500 is weighted by company size (as are most indexes with the exception of the Dow). This means a change in price of a large stock has more influence on the index than the change in price of a smaller stock.
Many financial professionals use the S&P 500 as the market when they measure the performance of an investment. How did the investment perform relative to the S&P 500? This is especially true in the mutual fund business.
The Nasdaq Composite
The Nasdaq Composite tracks some 3,000+ stocks, many of which are small technology companies. The Nasdaq is weighed by size and home to technology giants like Microsoft, Intel, and others. In addition, many survivors from the dot.com boom and bust remain on the Nasdaq, including Amazon.com. It is also home to many young technology companies.
This makes the Nasdaq the most volatile of all the indexes and not even close to representing the market. However, it does give you a good idea about where the technology stocks are headed.
Instructive indexes
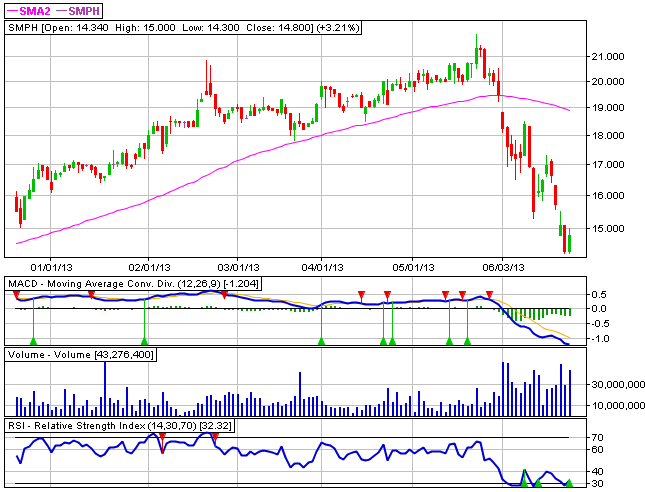
Long-term investors will find the indexes more instructive if they observe them as charts. That way it is easier to see trends. Yahoo.Finance is a great source for charts.


