IShares S&P SmallCap 600 Index (ETF) iShares Russell 2000 Index (ETF) The Only SmallCap Index ETF
Post on: 2 Апрель, 2015 No Comment

Have you ever wondered how billionaires continue to get RICHER, while the rest of the world is struggling?
I study billionaires for a living. To be more specific, I study how these investors generate such huge and consistent profits in the stock markets — year-in and year-out.
CLICK HERE to get your Free E-Book, “The Little Black Book Of Billionaires Secrets”
But the lesser followed S&P 600 Small Cap Index is, in many ways, the superior index. Although it only dates back to 1994, the S&P 600 still has 20 years of history to consider.
And over that time this index has done better than the Russell 2000. Much better, in fact.
Given that there are low cost ETFs that track both indices, investors looking for broad-based small cap exposure should carefully consider which index they want their ETF to track .
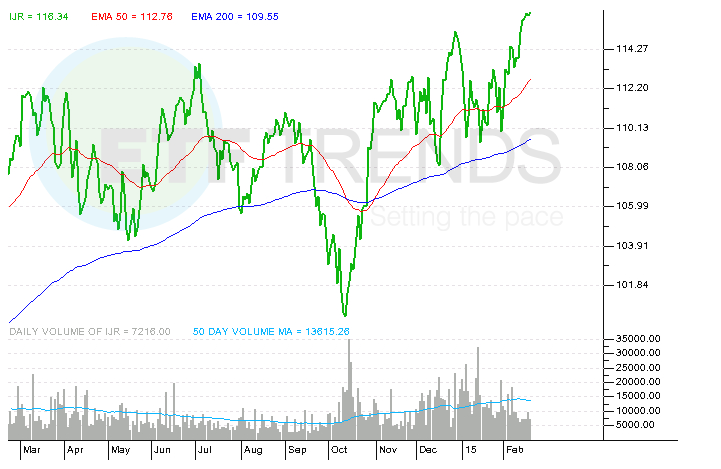
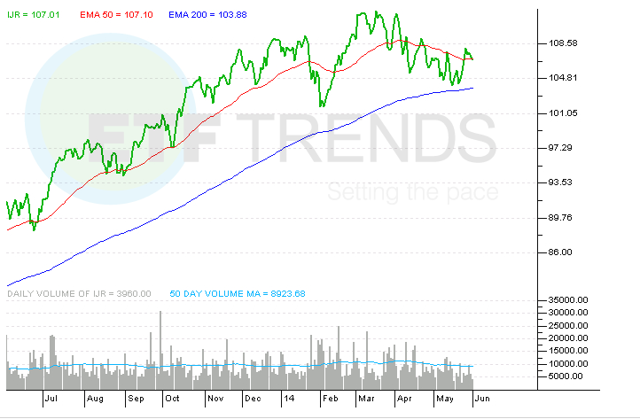
The two main options for the respective indices are offered by iShares. These are the iShares Russell 2000 Index Fund (NYSEARCA:IWM) and the iShares S&P SmallCap 600 Index (NYSEARCA:IJR). For me, the hands down winner is the IJR, given that it tracks the S&P 600 Index.
According to data from Index Fund Advisors, the S&P 600 Index delivered an annualized return of 11.05% between 1994 and 2013. By comparison, the Russell 2000 Index delivered an annualized return of just 9.27%, a full 1.8% of underperformance each year.
Now, on the one hand 1.8% a year doesn’t sound like a lot. Especially if you’re getting 9.27% returns every year. But…on the other hand, why miss out on the extra performance when gaining it requires no additional work or risk? There is no good answer.
And in actuality, over time 1.8% of extra performance each year adds up to a lot of money.
Let’s assume you invest $10,000 in each fund. And let’s further assume that the same annual returns that have persisted over the past two decades continue for the next two decades.

After just one year you’ll have $135 more if you invested $10,000 in the S&P 600 versus the Russell 2000. Not bad, but nothing to write home about.
But after ten years you’ll have $3,284 more.
And in year 20, you’ll have $17,654 more. That’s worth writing home about, especially since you’ll be sitting on $81,353 by investing in the S&P 600 as compared to “just” $63,699 with the Russell 2000. The chart below shows the impact of 1.8% outperformance over time.
There are reasons why the S&P 600 tends to outperform. And they’re not that complicated. The main reason is that the Russell 2000 is just the 2,000 smallest stocks among the 3,000 largest stocks in the U.S. stock market. There is no fundamental screen layered in. Also, the index is reconstituted each year so there are trading events that are well telegraphed to the market. Both of these factors likely lead to weaker performance for the Russell 2000.
In contrast, the S&P 600 Index has a profitability screen – companies must have posted four consecutive quarters of profits to be included. And there is no annual reconstitution, so traders can’t game the index – additions and deletions are decided by a committee.


