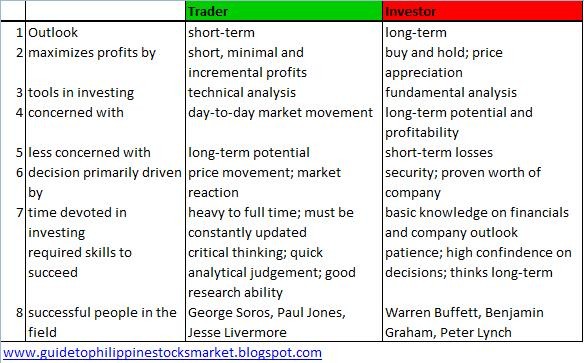
Investors traders and you
Post on: 30 Март, 2015 No Comment

Saturday, June 5, 2010
buy low sell high
buying low and selling high is the no brainer common sense method to trading. The concept of course is easy.
You buy a stock at a low price, and you sell it at a higher price than paid for. This is the theory of all profit wholesale/retail.
There are other options however, you can short stocks. Honestly I don’t recommend this because I feel it is risky. Here is the concept.
You sell a stock (without owning it in the first place) at a higher price, predicting the price will drop. you then buy the stock back at a lower price. in essence you make a profit because you sold the stock for more than you bought it. It is the reverse method of low selling high.
So how do you know exactly when a stock is at a good price to buy. There are several resources you can go by, and different strategies yield different results. of course I know you do not want to invest with a strategy that will lose you money. I don’t blame you.
When you look for a good entry point, listen to what experts are saying about that stock. Most will tell you when to buy, when to hold, and when to sell. You could do your own research however. Try this, using technical analysis, look at different indicators.
1. Bollinger bands
2. MACD
3. simple moving average
4. RSI
Each one will tell you different things. With Bollinger bands, think of it as a wall that the stock bounces off of. I’m over simplifying things, but I’m trying to educate the complete novice in stocks, so bear with me advanced traders.

With bollinger bands, when a stock nears either the upper or lower wall, you can almost (not always) predict that it will bounce back in the opposite direction. There are times, however, will the price will break out past the wall and either keep climbing or descending in trend. I strongly recommend you learn more advanced bollinger band strategies to predict how the stock works with this.
MACD (Moving average convergence divergence) is composed of a couple lines. the EMA (estimated moving average) and usual 12, 26. If the MACD 12, 26 crosses the EMA below the 0 middle line in an upward direction, you can predict that the stock will start rising. The opposite is also true. If the 12, 26 crosses the EMA above the 0 middle in a down ward direction, you stock will decrease in price.
MACD is a good way to predict short swing trades. Same goes for Bollinger bands.
I won’t go into the other two listed for times sake, but research them out.
Another thing is too look at the 52 week lows and highs. if you’re stock is near the 52 week low, it might be due for a bullish move. however it could just continue to drop and produce new lows, so be careful not to rely fully on this.
I hope most of this was helpful. If you liked this, you might want to check this out. If you liked this, please comment, follow and sign the newsletter for updates on new blogs. =D


