Investment calculations earnings per share and price
Post on: 26 Апрель, 2015 No Comment

August 10, 2012 at 10:00 am by Richard Rittorno
Last week we explained how to break apart a detailed quote. Now well tackle the investment calculations for earnings per share and the price/earnings ratio.
Analyze this.
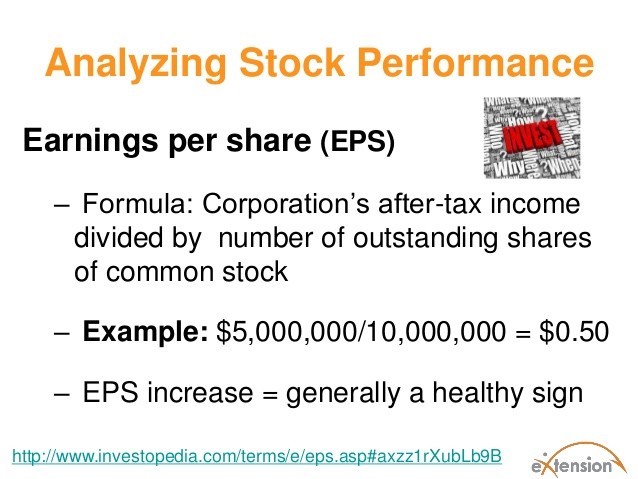
Earnings per share, or EPS, represents a company’s profits divided into its outstanding shares of common stock. For all intents and purposes, EPS represents the company’s profitability.
Among investment calculations, this is the formula for EPS:
Net income, minus preferred stock dividend payouts, divided by outstanding shares.
The equation is not hard math, but those who understand how the raw input numbers are calculated will have an advantage. The fact is, not all EPS are created equal. It is not uncommon for two different companies in the same space to have the same EPS but very different value.
Why? Since online brokers came on the scene, they have been providing traders and investors with a wealth of information, even doing calculations for them. However, this can do a company an injustice if you compare it with another without knowing how the raw input data was generated. Thats where investment calculations come in.
It is possible for two companies to have the same EPS, but with one generating its net income on less capital. In other words, generating income with less investment, which means less risk for the company.
Say a company generates the same amount of net income, resulting in the same EPS as another company. But if that net income requires more investment, the company with less risk investment will be stronger than the company with more investment risk.
This is a great example of why a successful trader/investor needs to dig into financial reports to determine how income was created. Doing a little homework and a few investment calculations provides you with knowledge that leads to success.
A price-to-earnings ratio, or P/E ratio, gives you a tool for comparing the current share price with EPS. If you have a look at EEM (quote ) youll be able to tell by looking at the P/E ratio whether you are paying high or low for the stock, and if you use it to compare two companies, which is more expensive. Ever heard someone say a $150 stock is cheap compared with a similar stock priced only $40? That refers to the P/E.
How do you determine which stock is cheaper? This is one of the simplest investment calculations: take the P/E ratio and divide it into the current price. If company A is trading at 2.4 times the current price and company B is trading 3.5 times, and all else is equal, company A is better value, even if company As stock price is $40 dollar more per share than company Bs. The P/E ratio allows you compare the companies on equal grounds.
The tricky part is at what ratio level does your investment style allow you to pull the trigger on a position? A common conservative number is 2.5 times price over P/E; others go even higher. With a little work in your investment calculations, you can look back and find the historical P/E to determine where the stock is in its cycle. For example, defensive stocks are higher because of fear when comparing with previous bull markets.


