Invest FAQ Technical Analysis Relative Strength Indicator
Post on: 2 Июль, 2015 No Comment

Last-Revised: 14 June 2008
Contributed-By: (Original author unknown), Chris Lott (contact me ), C. K. Krishnadas (ckkrish at cyberspace.org)
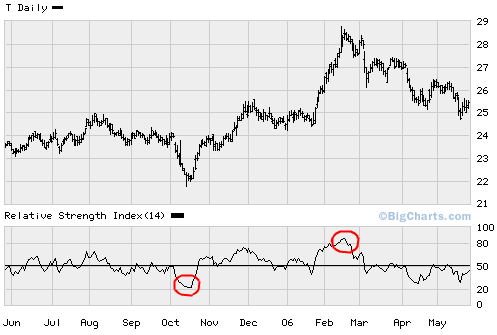
The Relative Strength Indicator (RSI) was developed by J. Welles Wilder in 1978. This indicator is one of a family of indicators called oscillators because it varies (oscillates) between fixed upper and lower bounds. This particular indicator is supposed to track price momentum.
Wilkder’s relative strength indicator is based on the observation that a stock which is advancing will tend to close nearer to the high of the day than the low. The reverse is true for declining stocks.
It’s easy to confuse Wilder’s relative strength indicator with other relative strength figures that are published. Wilder’s indicator compares the price performance of a stock to that of itself and might be more appropriately called an internal strength index. Other similarly named indicators compare a stock’s price to some stock market index or to another stock.
This indicator has evolved into several forms, but Wilder’s RSI is generally regarded as the most useful. The oscillator is indexed from 0 to 100, and like all oscillators it indicates overbought and oversold readings. The RSI oscillator is most useful in a
trading channel, especially those with deeply pronounced crests and troughs. Trending prices tend to distort overbought and oversold signals because indicator readings will be skewed off-center from a neutral reading of 50.
Very basically, buy signals are considered to be readings of 30 or less (the security is considered oversold) and sell signals are considered to be RSI values of 70 or greater (the security is considered overbought). Depending on the technician and price volatility, there are various other qualifiers and nuances that can be incorporated into a signal. For example, in very volatile markets, the bounds of 20 and 80 might be used to judge oversold and overbought conditions.
Another aspect of this indicator that is commonly varied is the period over which the indicator is calculated. Wilder began with 14 periods, but other values are common (e.g. 9 and 25).
The formula is as follows: The indicator (RSI) is calculated from the RS value as follows: Now that you have the general idea, you probably want to calculate some RSI values for stocks you’re following. Perhaps the easiest way is to visit one of the web sites shown below, which include spreadsheets that you can use immediately.
Here are some resources on RSI.

- The May 2000 issue of AAII Journal included a 5-page article about RSI with examples (they have a two-week free trial membership).
http://www.aaii.com
http://www.bigcharts.com
New Concepts in Technical Trading Systems


