Introduction to Day Trading Candlestick Charts
Post on: 10 Апрель, 2015 No Comment

Many people view day trading as an incredibly high risk form of investing. While it is true that day trading is a risky proposition for most, when done properly, it need not be much more risky than buy and hold investing. The problem is that most people do not possess the discipline, the knowledge and the resources to carry out the strategy properly. As a result, it is estimated by some that more than 70% of day traders actually lose money. This is why it is not recommended for even the above average investor. The FSA in the UK and the SEC in the US both warn against the dangers of day trading. They remind investors that while there is nothing wrong with day trading from a legal sense; it is a highly specialised form of trading that should only be practised by very experienced individuals.
What is a Day Trader?
A day trader is an investor who frequently sells stock the same day he purchased it. The goal of a day traders is to take advantage of the daily movements of highly liquid stocks. True day traders will rarely, if ever, hold a position overnight; they will sell the stock before the daily market closes. There are other forms of short-term trading that will purchase shares and seek to sell them again in a short amount of time that may or may not be more than one day. These are not true day traders and this is not the type of investing we are speaking of, although they occasionally get lumped into the same category and the strategies are somewhat similar.
How Day Traders Operate
Although day trading is most popular in the US market, UK day traders have been increasing in numbers as of late. The volatility in the market in recent years is seen a positive for day traders. They seek to take advantage of the swings by buying at low points and selling at the intraday high points, or as near to them as possible. The more volatile a stock is the better. In other words: the greater difference between the low point and the high point, the greater the opportunity for profit. Of course these volatile swings also lead to the chance at big losses.
If it were only as simple as buying at the stocks low point and selling at the high point of the day, trading in this fashion would be easy and everyone would do it. Unfortunately, accurately predicting the days high and low points is extremely difficult. So much so that even experienced, successful day traders do not all agree on the best process.
Candlestick Charts
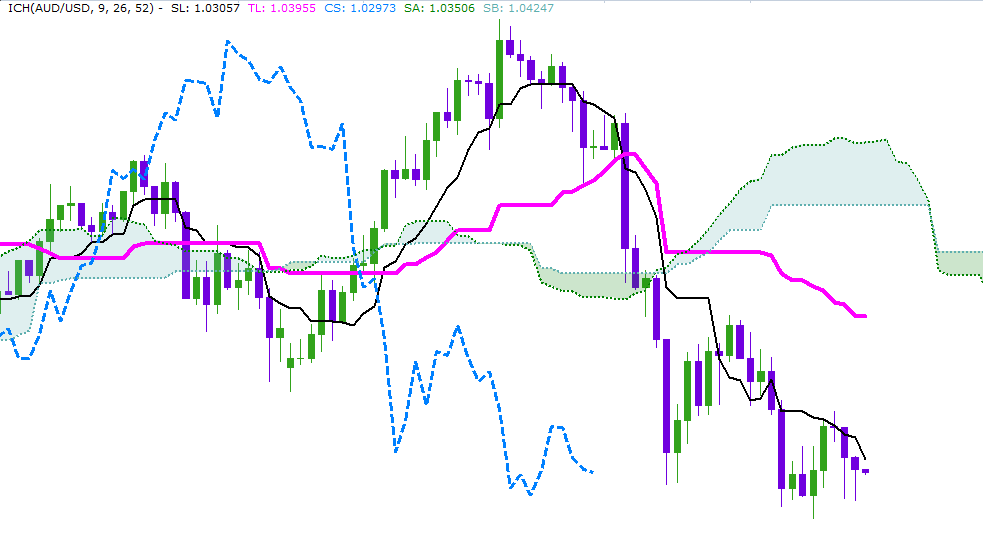
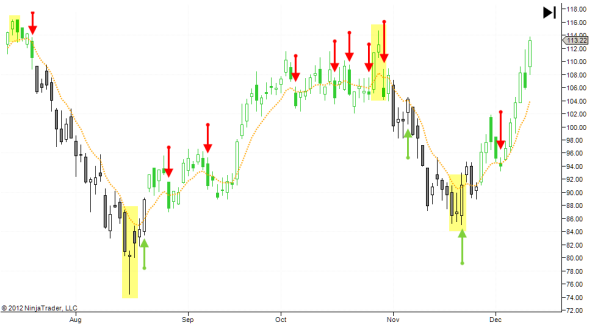
However, just about all day traders use what are often called candlestick charts to help analyse their targets and to judge when to execute their trades. The candlestick chart shows the investor the stocks opening price, closing price and intraday high and low, all in a line graph of sorts. The graph below shows an example of a candlestick chart.
Candlestick charts can look quite confusing, but are one of the essential elements to master for day traders. The above chart shows a stock over a three month period. You can see that it basically looks like a combination of a lines and bars. The lines, called shadows, represent the days high and low price for the shares, while the thicker bars, called the real body, represent the opening price and closing price. On days where there is a long thin line either above the bar, below it, or both, the shares started and ended the day further away from their high or low trading value for that day. Some days, you can only see the thicker bar, without a thin line at the top or the bottom. This means that the shares started and finished the day near the days high and low price. Days that the price of the shares opened and closed at the same price or very near the same price, the chart appears like a cross or a plus sign. The green lines represent days on which the stock ended the day above its opening price while the red bars represent days that the stock lost value.
The goal of one who is analysing candlestick charts is to find a recognisable pattern and to act upon it. Day traders have realised for a long time that the markets are often moved more on public sentiment than on any concrete basis. What we mean by this is that humans tend to make emotional responses to situations and will move en mass based on nothing other than good news, bad news, fear, greed, or other emotions. These responses affect the markets and the movements are often indicated by unique patterns that appear on the candlestick chart.
Candlestick Chart Explained
For instance, even in the chart above, which was originally chosen at random, we have great examples of what a trader may be looking for. Let us look at the chart again, this time with two blue boxes highlighting the days on which reversals took place.

On the first day, we have highlighted the fourth day of an upward trend. This type of candlestick is called a hanging man. Basically, we can see that the price for the day started well above the previous days close, and then was somewhat volatile throughout the day. The price dropped from the open, then rallied a bit more to end the day higher. In a very strong hanging man, we would see the shadow being a bit longer than in this case. A hanging man represents a reversal from an upward trend toward a downward, or bearish, trend. We can see the drop in this case was not very sharp but was sustained over a long period.
In the second blue box, we have highlighted what is called a hammer. This represents the reversal from a bearish trend to a bullish, or upward, trend. We can see the hammer is very well defined in this case. The shares began trading lower than the previous close and during the day fell sharply, only to rally and close lower, but only slightly lower than the open. This creates a very recognisable hammer candlestick, with a short real body at the top and a long shadow underneath. After this day, the stock rallied for gains in ten of the next thirteen day.
Quickly recognising these trends real time is much more difficult than looking at a chart after the fact and picking out the signals. Day traders would be looking at intraday candlestick charts and comparing them to previous charts to try to spot trends. While candlestick charts are very widely used, they are not the only means of predicting trends for day traders. Some traders will use information such as trading volume, wide gaps in trade pricing and even financial news to make split second decisions.
Minimising Risk
Many traders will reduce their risk by executing trades nearly as soon as they become profitable, rather than to wait for greater gains. One key to minimising losses on bad trades is to have a very solid exit strategy on any position that you open. This can be done with the use of stop losses and disciplined planning and trading. A lot of traders will also have a long term portfolio in addition to their trading account. This can also help to lessen the risk in your overall account.
Managing Your Capital
If you are considering delving in to day trading, it is important to first consider how much of your capital you are willing to chance. It is possible to lose a large amount of money in one day and risk is absolutely part of the equation in day trading. You would be well advised to risk no more than 20% of your capital in a day trading account (not on one trade). This money should be treated as a separate account altogether and then you should only risk a small portion of this on any single trade, perhaps about 5% of your day trading capital. By using a disciplined money management system, you can keep your risk to a minimum while learning and practising your skills as a trader. In fact, a practice account is an excellent way to learn. Many online stockbrokers offer practice accounts with no cost or obligation. With a lot of studying and practice, day trading can be quite profitable and does not have to be an extremely risky proposition.


