Intraday Trading indicators Indicates the price trend
Post on: 2 Июль, 2015 No Comment

Intraday Trading indicators — Indicates the price trend.
Related Topics:
Intraday trading > intraday trading indicators
Introduction: Intraday trading indicators help to predict price movement by technical analysis of charts of different types.Trading indicatorsare calculations based on the price and the volume of a security that measure such things as money flow, trends, volatility and momentum
.Traders use indicators to confirm price movement and the quality of chart patterns, and to form buy and sell signals.
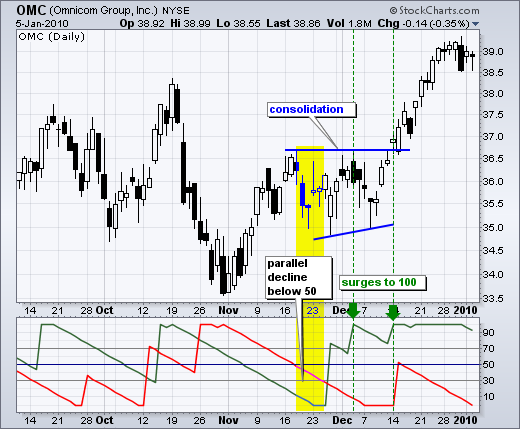
Stochastic Indicator: This is one of the intraday trading indicators day traders use.Using the Stochastic method we can compare the current stock price to its overall price range over a specified period of time. The term stochastic refers to the location of a current price in relation to its price range over a period of time.
The theory of the stochastic indicator is based on the principal that in an up trending market, stocks tend to close near their highs & in a downward market stocks tend to close near their lows.
We use the stochastic indicator to plot two lines on a chart with the values from 0 to 100. These are the %D & %K with the %D line being the more significant of the two. If the readings are above the 80 line then this signifies that the stock price is nearing its high & will reverse soon. If the readings are below 20 then this would mean that its at its lowest point.
I n a Ranging market go long on bullish divergence (on %D) where the first trough is below the oversold level.
Go long when %K or %D falls below the oversold level & rises back above it.
Go long when %K crosses above %D
Go short on bearish divergence (on %D) where the first peak is above the overbought level.
Again go short when %K or %D rises above the overbought level & then falls back below it
Finally go short when %K crosses below %D
In a trending market the shape of the stochastic bottom can give you some indication of a rally. If the bottom of the stochastic indicator is narrow but not very deep, this indicates that the following rally should be strong. If the bottom is deep & broad then this means that the rally should be weak.
We can also apply this to the tops of the stochastic indicator. If the tops are narrow then this means that the bulls are weak & that a correction is likely to follow. If the tops are high & wide then this indicates that the bulls are strong. Remember to get the most out of stochastic indicators make sure you know which market youre trading in i.e. Ranging or trending & always use this indicator with other indicators like Moving Average or Moving Convergence etc etc.
Below is an example of stochastic indicator:
Relative Strength Index (RSI): A technical momentum indicator that compares the magnitude of recent gains to recent losses in an attempt to determine overbought and oversold conditions of an asset. It is calculated using the following formula:
RSI = 100 — 100/1 + RS*
*Where RS = Average of x days’ up closes / Average of x days’ down closes
Relative strength indicator works just like any other momentum oscillator.
- It indicates whether the market is moving to new highs, new lows, or is just meandering in the middle
- It uses recent price and volume data to aid in assessing whether a recent change in trend will continue or revert to it’s prior state
- And last but not least, it’s used to pin point overbought and oversold signals

The Relative strength index formulae:
A charting representation of RSI:
Moving Average Convergence Divergence (MACD): Moving Average Convergence-Divergence (MACD) is one of the simplest and most effective momentum indicators day traders use. The MACD indicator is one of the most popular technical analysis tools.It shows the relationship between two moving averages of prices. The MACD is calculated by subtracting the 26-day exponential moving average (EMA) from the 12-day EMA. A 9-day EMA of the Moving average convergence divergence(MACD), called the signal line, is then plotted on top of the MACD, functioning as a trigger for buy and sell signals.
Three common methods used to interpret the MACD:
1. Crossovers — As shown in the chart above, when the MACD falls below the signal line, it is a bearish signal, which indicates that it may be time to sell. Conversely, when the MACD rises above the signal line, the indicator gives a bullish signal, which suggests that the price of the asset is likely to experience upward momentum. Many traders wait for a confirmed cross above the signal line before entering into a position to avoid getting getting faked out or entering into a position too early, as shown by the first arrow.
2. Divergence — When the security price diverges from the MACD. It signals the end of the current trend.
3. Dramatic rise — When the MACD rises dramatically — that is, the shorter moving average pulls away from the longer-term moving average — it is a signal that the security is overbought and will soon return to normal levels.
Graphical representation of MACD charting pattern:


