Indicators for Swing Trading
Post on: 9 Октябрь, 2015 No Comment

exacttrades January 4, 2012 0
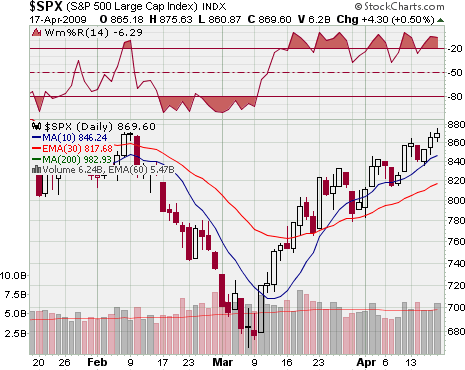
Swing trading is method of trading where you are trying to capture gains in a financial instrument on price moves last 2 to 10 days. Opinions vary regarding the time frame but based on our own strategies weve found very successful swing trades that have lasted up to 10 days. We primarily focus on swing trading using technical analysis and this article will go over some of the most common indicators for building your own swing trading strategy.
MOVING AVERAGES
One of the most commonly used indicators in swing trading is the moving average. The most widely used period for swing trading is the 200 day simple moving average. A simple strategy is a 200 day simple moving average cross-over. In this strategy you scan for stocks that are near their 200 day moving average and you look to take those long that move over the 200 and go short those crossing below their 200 day moving average. Its our view that you can improve performance by combining multiple technical indicators along with the use of support/resistance levels and market strength/weakness.
STOCHASTIC INDICATORS
Stochastic indicators belong to a group of technical indicators that are used to spot price momentum. This indicator typically oscillates between 0 and 100 and a stock is considered overbought if the value is over 80 and oversold if the value is under 20. Weve found that this tool can be very valuable not only in averaging your entry into a trade setup but also to identify those trades that are lagging and can give a red flag that should reduce your risk greatly reducing your loss on busted trades.
MOVING AVERAGE CONVERGENCE-DIVERGENCE (MACD)
Another very popular indicator used is swing trading strategies is the MACD. Known as Moving Average Convergence-Divergence, this is another momentum indicator that is used to expose possible reversals in price trends. The MACD will move above and below a center zero line as the two moving average lines converge and then diverge. One way to trade this is to look for a cross of the moving averages at the highs and lows of the channel to signal a trade entry. The MACD is not good at identifying overbought and oversold levels so it typically works best when combined with a stochastic indicator.
THE BOTTOM LINE
Read the next line out loud to yourself. There is no magic bullet indicator. Say it several times to make sure you get it. The best way to use these indicators in a trading strategy is when they are used in combination with support/resistance levels, trend lines and volume. We also recommend you experiment (while virtual trading and/or backtesting) with different types and settings of Moving Averages, Stochastic Indicators and MACD to find just the r


