Improve Your Investing With Excel
Post on: 12 Июнь, 2015 No Comment

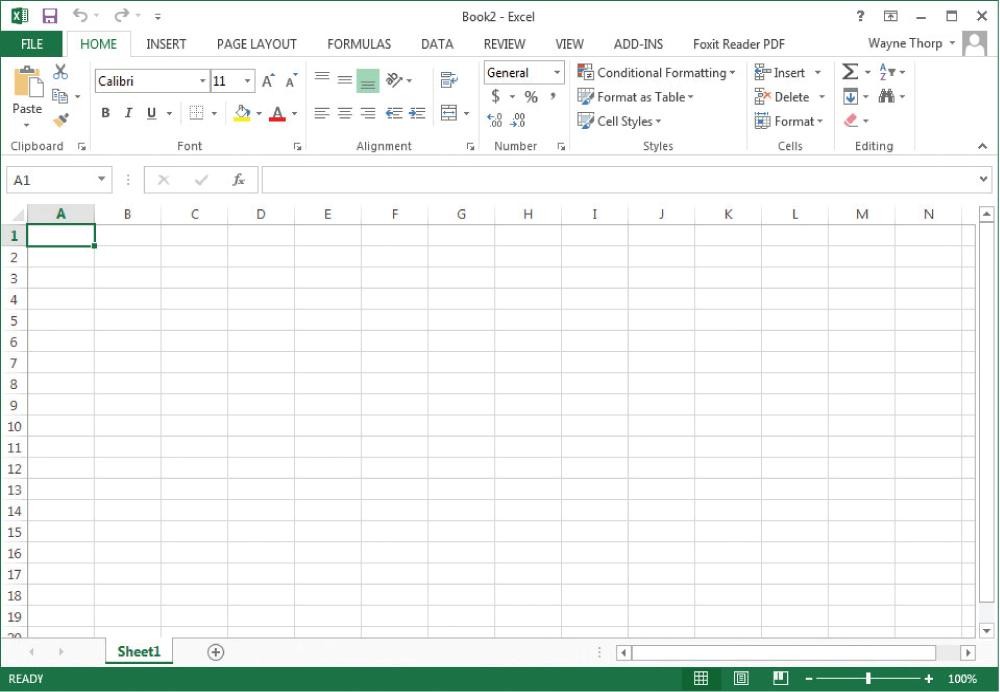
Microsoft’s Excel spreadsheet program allows investors to keep track of investment activity in an organized manner. Using Excel, investors can track positions, including entry price, periodic closing prices and returns. Another valuable feature of Excel is that it can automatically calculate an investment’s or portfolio’s standard deviation. The standard deviation value is synonymous with risk in regard to modern portfolio theory. and can assist investors by evaluating an investment’s or portfolio’s volatility. This article will briefly explain modern portfolio theory, standard deviation and how Excel can be used to enhance one’s investment activities.
Modern Portfolio Theory
Modern portfolio theory (MPT) was developed by Harry Markowitz, and introduced in the 1952 Journal of Finance. The central focus of MPT is that investors should not limit themselves to the expected risk and return of one particular stock; rather, an investor should reduce risks through diversification. MPT states that the risk in a portfolio of diverse stocks (or other investment instruments) will be less than the risk of any one of the stocks. A key point here is diversification: it is not adequate to simply own 20 different stocks. Instead, a diversified portfolio will be comprised of instruments that are relatively unrelated in order to mitigate the risks in the event that one sector or type of investment performs poorly.
According to MPT, risk involves two elements: systematic and unsystematic risk. Systematic risk includes risk factors that cannot be reduced through diversification, the risk that’s inherent in the overall market. Unsystematic risk is tied to individual investment products and can be diminished through the use of diversification. A goal of modern portfolio theorists is to limit risk, or the deviation from the mean, by holding a well-diversified portfolio. (To learn more, see Modern Portfolio Theory: Why It’s Still Hip .)

Since the standard deviation measures the degree to which a stock’s or portfolio’s returns vary, or deviate, from average returns, it can be a useful metric in assessing volatility and risk. The standard deviation of returns is a more accurate measure of volatility than looking at periodic returns because it takes all values into account. The lower the standard deviation value, the lower the risk.
Using Excel to Track Investments
An Excel spreadsheet can be used in a number of ways to keep track of investment activity. The first step is to decide what data you would like to include. Figure 1 shows an example of a simple Excel spreadsheet that tracks one investment’s data, including date, entry, size (how many shares), closing prices for the dates specified, the difference between the closing price and the entry price, the percentage return, profit and loss for each periodic closing price, and the standard deviation. A separate sheet in an Excel workbook can be used for each stock.


