Identifying A Stock Breakout Online Stock Trading Guide
Post on: 16 Апрель, 2015 No Comment

Finding a possible stock breakout before it occurs can greatly increase your chances of having a profitable trade. This includes being aware of moves to the upside as well as to the downside.
While this is just one method to look for an entry point into a stock position, there are many others as well. For instance, some traders and investors look to enter a position only on a Pullback from a resistance level. While this can be even more profitable, you may not always be able to enter on a pullback based on your timing.
I know, I used the timing word. We all have heard that you cannot Time the market. But whether you look for entry points on a pullback or a breakout, aren’t we trying to Time our entry either way?
I say yes, we are. I also say that we can sure try as well. When you hear that no one can be successful at Timing the market, most of the time they are referring to timing major bottoms or tops in the market. Any skills and knowledge of ways to analyze stock charts for good entry points is only a benefit to our trading success.
Any website, trading service or trading newsletter uses some type of Timing method to enter into new positions.
I will be showing an example of a stock breakout to the upside using a current chart that is a follow up of what I showed on a previous trend lines page.
The chart below from my Trend Lines page shows the short term price movement of HUM (Humana) trading in a downward sloping channel. At the time, HUM was at the top trend line or resistance level, close to $30.00.
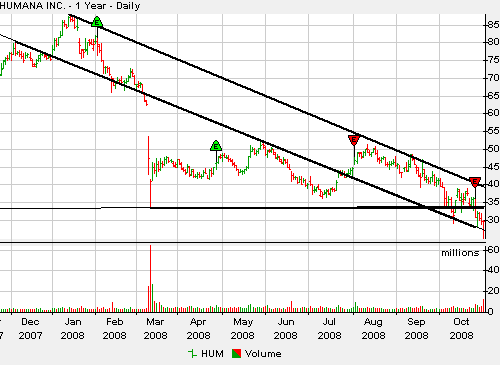
The chart below from my Trend Lines page shows the long term price movement of HUM (Humana) trading in a downward sloping channel. At the time, HUM was near the bottom of the long term trend line or support level, again close to $30.00.
The following two quotes are from November 2, 2008 to my free Market Trader Ezine Subscribers noting a possible breakout:
The stock may continue to trade in its current longer term channel, with a short term target of around $38.00 at the top of the channel.
If any good news pushes this stock up past $33.00 then the next resistance point would be the top line of around $38.00.
Here is a current chart of HUM showing what happened, one week later:
Using the trend lines on last weeks short term 10 day chart, we can see that every time HUM reached the top resistance level, it reversed and went lower. If we were looking for a possible breakout to the upside, we could have the following trading rule in place:
Since the stocks price appears to reach upper level support and reverse, if the stock price were to breakout to the upside it would have to not reverse at this upper resistance level. Therefore, if HUM opens up or goes above this upper resistance level, enter into a long entry position with a tight stop loss at the upper resistance level that it broke through, just in case we are wrong.

With a trading rule like this in place, we could have entered into a long position on Monday November 3, 2008 somewhere between $30.00 and $31.50 (this is a 15 minute chart). At this point we would have our stop loss set at the point where it broke through resistance at about $30.00 to safeguard against it being a fake breakout.
Using the long term chart as shown above and referenced in my November 2, 2008 free Market Trader Ezine issue, we can see that the next upper resistance level was at around $33.00 previously set in March 2008.
You can see what happened this week on November 3rd and 4th. The price went sideways as traders and investors battled to see if more upside potential was justified or not. On November 5th we see that it was.
Having our stop loss set at around $30.00 would have helped to protect us in case of an intraday reversal at the $33.00 level to back into the lower trading channel. At the same time it allows us to participate in potential further upside movement.
On November 5th, you can see that it went just over $37.00 which is getting close to the upper long term resistance level shown in the 2nd chart above. Again, investors and traders are deciding whether or not a further move to the upside is in store. At this point, moving your stop loss up to the previous level of uncertainty, $33.00, would be a wise decision. This would help protect profits of a minimum of around 10% while allowing for a further move to the upside.
The other option would be to take profits of around 15% in a weeks time. With the large daily moves in stock prices lately, this would not be a bad choice either. It would depend on your personal preference of course.
You can use the same methods as looking for a breakout to the upside I have shown above for a potential breakdown through a bottom support level. You will just have to adjust the trading rules for the downside of course.
Here are additional pages to learn about Breakouts and Technical Analysis on this website:
Remember, these are only my examples of using trend lines and looking for a potential stock breakout. Please use your own judgement before making any financial decisions, and of course consult your licensed financial advisor:)


