How To Use Stochastic Indicators In Your Stock and Options Trading
Post on: 16 Март, 2015 No Comment

Stochastic indicators are a fantastic technical analysis tool, but what exactly are they and how can you use them in your stock and options trading?
Stochastic indicators were developed by George Lane in the 1950s and are a momentum indicator that shows the location of the closing price relative to the recent high-low range. The stochastic indicator is helpful in identifying overbought and oversold levels. However, the primary use for which Lane created this indicator was for spotting bullish and bearish divergences. Stochastics are a momentum indicator, as we will see shortly, momentum often shifts before price does, and spotting these instances can be a great method for entering your stock and options trades.
I wont go into the details of the calculations behind the stochastic oscillator, but if youre interested, there is some great information on stockcharts.com
USING STOCHASTICS IN STOCK AND OPTIONS TRADING
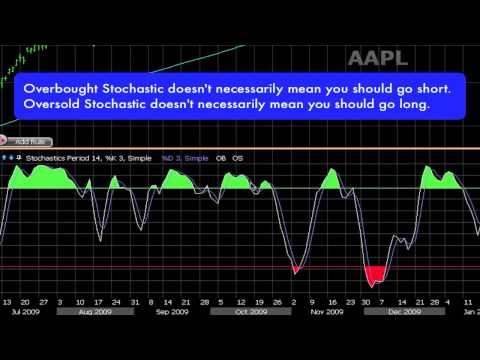
In terms of overbought / oversold levels, the indicator ranges from 0 to 100 with standard settings for overbought set at 80 and oversold set at 20. One thing to keep in mind is that an oversold reading is not necessarily bullish and an overbought reading is not necessarily bearish. You will often see in a strong uptrend an overbought reading for an extended period of time as the stock continues to rally. The same can be said during strong downtrends where a security can reach an oversold reading and remain oversold for some time. Particularly in downtrends, stocks may see the bulk of their declines AFTER reaching oversold levels (see below). It is therefore important to take into account the overall trend when using stochastic indicators. If the market is in a strong uptrend, you should ignore the frequent overbought readings and look to buy on the occasional oversold reading. Likewise, look for occasional overbought readings in a strong downtrend and ignore the frequent oversold readings.
You can see in the below picture that SPY first hit an oversold reading in late May after it had declined from 144 to 137. The ETF then proceeded to decline a further 13% to 119. This clearly illustrates the dangers of using stochastic indicators as you sole means of determining trade entry points.
This chart shows SPY in a clear up trend. Both the 50 day and 200 day exponential mount averages are rising and in August 2009, the 50 crossed above the 200. You can easily see the benefits of getting long on an oversold stochastic reading when the market is in a clear uptrend. The first two points illustrated coincided with successful tests of the 50d EMA, which would have acted as confirmation of the buy signal. The third circle shows a successful test of the 200d. The period from March to April 2010 also shows why it pays to ignore overbought readings in an uptrend.
DIVERGENCE
Another very useful method of using stochastic indicators is in recognizing bullish and bearish divergences. This is something I use frequently in my trading. The premise is that when a new high or low in a security is not confirmed by the stochastic indicator, it indicates a potential trend reversal. For example, a bullish divergence occurs when price makes a LOWER low, but the indicator makes a HIGHER low. This shows that the downside momentum is slowing, even though prices are continuing to make new lows, and a trend reversal may be imminent. Bearish divergences occur when prices make a HIGHER high, but the stochastic indicator makes a LOWER high.
Bullish Divergence
The chart below shows an example of bullish divergence. SPY makes a low in both price and the stochastic indicator, then makes an EQUAL low in price, but a clear HIGHER low in the indicator. This would be a good buy point with your stop loss placed just below the low in price. After this bullish divergence, SPY went on to rally 0.75% in a matter of minutes. Youll notice that you can spot divergence on any timeframe, this example being a 2 minute chart.
In this example, we see what is a stronger form of stochastic divergence, where prices make a lower low (rather than an equal low), and the indicator makes a higher low. This was a strong buy signal and SPY went on to rally 17% before having any sort of meaningful pullback.
Bearish Divergence
The bearish divergence shown below is plain to see, with SPY making higher highs while the indicator is making lower highs. This shows that the momentum is stalling and sure enough, SPY fell by 5% shortly after.
CONCLUSION
The stochastic indicator is one of my favorite charting tools and one that I generally have on all my charts no matter what time frame I am looking at. It is said that this indicator is more useful in range bound markets, however, I think it can also be used to good effect in trending markets by looking for divergences or using overbought and oversold readings to trade with the trend.
Do you use stochastic indicators on your charts? Can you see any current examples of divergence?

RECOMMENDED READING ON STOCHASTIC INDICATORS
Kirkpatricks book is probably the most comprehensive and reliable book on technical analysis, so you cant go wrong with that one. His book is the one recommended by the Market Technicians Association as a study guide for the increasingly popular Chartered Market Technician (CMT) Designation. In addition to the technical analysis side of things, the books also details other trading related concepts such as investment systems and portfolio management plans.
And from John Bollinger, creator of Bollinger Bands:
Murphys book is as comprehensive a guide to technical analysis as you will find. He is a former technical analyst for CNBC and director of Merrill Lynchs Technical Analysis Futures Division. Heres what Amazon has to say about his book:
Prings book also comes highly recommeded by the MTA. Here is some critical aclaim for his book:
One of the best books on technical analysis to come out since Edwards and Magees classic text in 1948Belongs on the shelf of every serious trader and technical analyst.
Roberts and Magees book is a must have for any serious trader. Originally written in the 140s, it is as relevant today as it was then. Heres what Amazon has to say:
Technical Analysis of Stock Trends was the first book to produce a methodology for interpreting the predictable behavior of investors and markets. It revolutionized technical investment approaches and showed traders and investors how to make money regardless of what the market is doing. Now in its ninth edition, the book remains the benchmark by which all other investment methodologies are measured. An indispensable reference for technical traders, investors, and finance professionals, the ninth edition features: * Expanded treatment of Magees basing points procedure * In-depth discussion and dissection of Dow Theory * Extensive new material on commodity trading * Much-needed perspective on short-term and futures trading The newest incarnation of one of the true classics of market analysis, this book will be a crucial resource for both seasoned veterans and the new generation alike.
STOCHASTIC DIVERGENCE VIDEOS
This video from DayTraderRockStar goes over a different type of divergence that I have not touched on above. This method is where the indicator makes a new high (or low), but prices fail to make a new high (or low). I tend not to trade this method of stochastic divergence as I prefer the method outlined above. However, I thought is might be useful to include this as some people may prefer this method. Thanks to DayTraderRockStar for the very well put together video.


