How To Use Beta
Post on: 21 Апрель, 2015 No Comment

In finance, the Beta of a security (or portfolio) is used as an indicator of its historical volatility in regards to a benchmark, generally the New York Stock Exchange (NYSE) Composite Index or the S&P 500 Index. At Value Line, we derive the Beta coefficient from a regression analysis of the relationship between weekly percentage changes in the price of a stock and weekly percentage changes in the NYSE Composite Index over a period of five years. In the case of shorter price histories, a shorter time period is used, but two years is the minimum. Value Line then adjusts these Betas to account for their long-term tendency to converge toward 1.00. (Though the scope of this convergence is beyond our purposes here, readers can refer to M. Blume, “On the Assessment of Risk,” Journal of Finance, March 1971 for further details.)
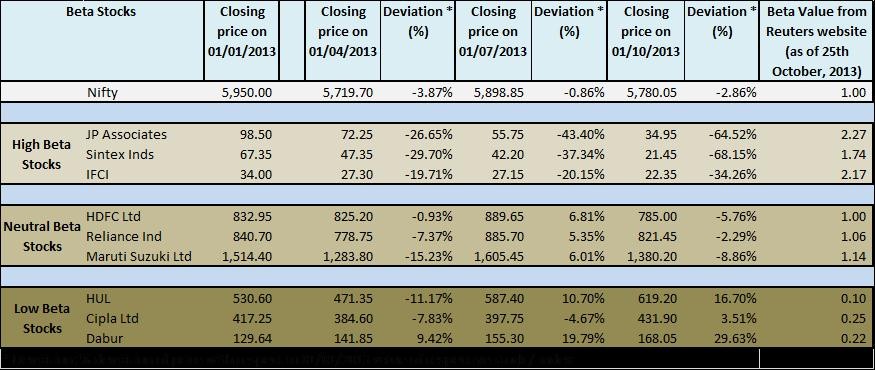
Now that we have our Beta number, what does it mean? If an equity mirrors the benchmark, then it carries a Beta of 1.00. If Stock X has a Beta of 2.00, it is expected to rise (or fall) twice as much as the movement of the benchmark. For example, if the NYSE Composite Index rises (falls) 10%, Stock X will likely rise (fall) 20%. (For a more detailed overview, see Understanding Beta ). Beta can also be negative (infrequent but possible), which would mean that the equity’s return tends to move in the opposite direction from the market’s move. Moreover, there is no upper or lower bound to Beta, although it typically does not stray too far from 1.00. Finally, a Beta of zero does not mean the asset is risk-free, just that the correlation of that asset’s return to the market’s return is zero.
Now that we know what Beta is and its implications, how can we use it? If we were able to predict the movements of the overall market, we would simply buy high Beta stocks while the market rises, and low Beta stocks while the market is falling. However, no one is capable of timing the market over the long term. So, what should we do?
If we define a high risk asset in terms of the movement of its price, we can look towards Beta as one indicator of this riskiness. Though Beta by itself does not give a perfect indication of volatility, it does imply the direction and magnitude of movements. Using Beta as a measure of risk, we can relate this to a basic tenet of finance theory, which states that investors demand a return in exchange for assuming risk. Therefore, high-risk (or high-Beta) investments should provide a higher payout, and conversely, low-risk (or low-Beta) investments should provide a lower payout. This proposition seems reasonable and intuitive, but it may not always hold.
In a paper entitled “Re-Thinking Risk: What the Beta Puzzle Tells Us about Investing,” written by David Cowan and Sam Wilderman of GMO LLC, they show just the opposite. For the paper, Beta was measured using 250-day returns of a universe of 1,000 stocks, regressed against 250-day returns of that universe. Low- and high-Beta Portfolios were then formed monthly and weighted by market capitalization, with the universe used as the benchmark. Their results present data starting in December, 1969 and show that high-Beta stocks have significantly underperformed the market (average annualized return of 7.2% vs. 10.6% for low-Beta and 9.8% for the universe), and done so with substantially higher annualized volatility (24.5% vs. 12.5% and 16.0%, respectively) and larger drawdown (-84.4% vs. -39.5% and -50.3%, respectively).
Though low-Beta may trump high-Beta over longer periods, there are some problems with solely relying on the Beta coefficient. It is a backward looking metric, and therefore may not be an accurate predictor of the future. The markets change all the time and just because a relationship held in the past does not mean it is certain to continue into the future. Also, since it is solely a statistical measure, it fails to consider underlying business fundamentals or economic developments. Consider Altria Group (MO ). This stock has a Beta of 0.55 and the company primarily sells cigarettes. Due to the low Beta, we may say this is a low-risk stock. However, if for some reason cigarettes were deemed illegal to sell, this company would probably not stick around very long and any investment in the stock will likely become worthless. Solely looking at a stock’s Beta will not uncover this risk.
So, back to our question posed earlier; what should we do? We propose Beta should be used as one factor in the equity analysis framework. Investors should also look at our Safety rank and Price Stability score when making investment decisions. Considered in conjunction with Value Line’s fundamental research and valuation ratios, we believe investors can create a portfolio that may provide superior risk-adjusted returns over the long haul.
At the time of this article’s writing, the author did not have positions in any of the companies mentioned.


