How to Trade with Bollinger Bands 4 Winning Strategies
Post on: 16 Март, 2015 No Comment

84 Flares Twitter 14 Facebook 67 Google+ 3 Filament.io More Info ‘> 84 Flares
Odds are you have landed on this page in search of bollinger band trading strategies, secrets, best bands to use or my favorite the art of the bollinger band squeeze. Before you skip down to the section titled bollinger band trading strategies which covers all these topics and more; let me impart two additional resources on the site that are of value to you: (1) Trading Simulator (you will need to practice what you have learned) and (2) Indicators Category (confirming your bollinger band strategy with another indicator is always a plus).
Bollinger Band Indicator
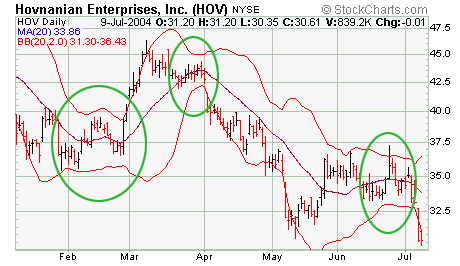
Bollinger bands are a very powerful technical indicator. Some traders will swear that solely trading bollinger bands is the key to their winning systems. Bollinger bands are drawn within and surrounding the price structure of a stock. It provides relative boundaries of highs and lows. The crux of the bollinger band indicator is based on a moving average that defines the intermediate term trend of the stock based on the trading timeframe you are viewing it on. This trend indicator is known as the middle band. Most stock charting applications default the middle band to a 20 period moving average. The upper and lower bands are then a measure of volatility to the upside and downside. They are calculated as two standard deviations from the middle band.
Lower Band = Middle band 2 standard deviations.
Bollinger Bands
Bollinger Band Trading Strategies
Many of you have heard of traditional patterns of technical analysis such as double tops, double bottoms, ascending triangles, symmetrical triangles, head and shoulders top or bottom, etc. The bollinger bands indicator can add that extra bit of firepower to your analysis. They can help you understand certain characteristics of a stock such as the high or low of the day, whether or not the stock is trending, or even if it is volatile or not. On occasion when trading the bollinger bands, you will see the bands coiling very tightly which indicates the stock is trading in a narrow range. This is the trigger to watch for a price breakout or breakdown. Many times, large rallies begin from low volatility ranges. When this happens, it is referred to as building cause. This is the calm before the storm.
Double Bottoms and Bollinger Bands
A common bollinger band strategy involves a double bottom setup. The initial bottom of this formation tends to have strong volume and a sharp price pullback that closes outside of the lower Bollinger band. These types of moves typically lead to what is called an automatic rally. The high of the automatic rally tends to serve as the first level of resistance in the base building process that occurs before the stock moves higher. After the rally commences, the price attempts to retest the most recent lows that have been set in order to test the vigor of the buying pressure that came in at that bottom. Many bollinger band technicians look for this retest bar to be inside the lower band. This indicates that the downward pressure in the stock has subsided and that there is a shift now from sellers to buyers. Also pay close attention to the volume, you need to see it drop off dramatically.
Below is an example of the double bottom outside of the lower band which generates an automatic rally. The setup in question was for FSLR from June 30, 2011. The stock hit a new low with a 40% drop in traffic from the last swing low. To top things off, the candlestick struggled to close outside of the bands. This led to a sharp 12% rally over the next two days.
Bollinger Bands Double Bottom
Reversals with Bollinger Bands
Another simple yet effective trading method is fading stocks when they go outside of the bands. Now, take that one step further and apply a little candlestick analysis to this strategy. For example, instead of shorting a stock as it gaps up through its upper band limit, wait to see how that stock performs. If the stock gaps up and then closes near its low and is still completely outside of the bollinger bands, this is often a good indicator that the stock will correct on the near-term. You can then take a short position with three target exit areas: (1) upper band, (2) middle band or (3) lower band. In the below chart example, the Direxion Daily Small Cap Bull 3x Shares (TNA) from June 29, 2011 had a nice gap in the morning outside of the bands, but closed 1 penny off the low. As you can see in the chart, the candlestick looked terrible. The stock quickly rolled and took an almost 2% dive in under 30 minutes, proving very profitable for any day trader.
Bollinger Band Reversal
Riding the Bands
The single biggest mistake that many bollinger band novices make is that they sell the stock when the price touches the upper band or conversely buy when it touches the lower band. Bollinger himself stated that a touch of the upper band or lower band itself does not constitute a buy or sell signal. Not only have I seen, but I have also traded this bollinger band strategy as a continuation trade. Using other technical indicators and pattern recognition, you can actually trade in the direction of a stock that is closing above or below the upper and lower band.
Take a look at the example below and notice the tightening of the bollinger bands right before the breakout and to my point above, a price penetration of the bands cannot alone be considered a reason to short a stock or sell it. Notice how the volume exploded on that breakout and the price began to trend outside of the bands. These can be extremely profitable setups.

BSC Bollinger Band Example
I want to touch on the middle band again. The middle band is set as a 20 period simple moving average as a default in many charting applications. Every stock is different and some will respect the 20 period and some will not. In some cases, you will need to modify the simple moving average to a number that the stock respects. This is curve fitting but we want to put the odds in our favor. You can use this line to represent areas of support on pullbacks when the stock is riding the bands. You could even add an additional position in the stock using this technique.
Conversely, the failure for the stock to continue to accelerate outside of the bollinger bands indicates a weakening in strength of the stock. This would be a good time to think about scaling out of a position or getting out entirely. Additionally, we should look for higher highs and higher lows as we ride the Bollinger bands.
Bollinger Band Squeeze
Another bollinger band strategy is to gauge the initiation of an upcoming squeeze. He created an indicator known as the Band width. This formula is simply (Upper Bollinger Band Value Lower Bollinger Band Value) / Middle Bollinger Band Value (Simple moving average). The idea, using daily charts, is that when the indicator reaches its lowest level in 6 months, you can expect the volatility to increase. This goes back to the tightening of the bands that I mentioned above. This type of squeezing action of the bollinger band indicator foreshadows a big move. You can use additional indicators such as volume expanding, or did the accumulation distribution indicator turn up, or does the price range narrow on down days? These additional indications add more evidence of a potential bollinger band squeeze.
We need to have an edge though when trading a bollinger band squeeze, because these types of setups can head-fake the best of us. Notice above in the BSC chart how the price expanded on the opening of 9/26. It immediately reversed and all the breakout traders were head faked. You dont have to squeeze every penny out of a trade. Wait for some confirmation of the breakout and then go with it. If you are right, it will go much further in your direction. Notice how the price and volume broke when approaching the head fake highs (yellow line).
To the point of waiting for confirmation, lets take a look of how to use the power of a bollinger band squeeze to our advantage. Below is a 5-minute chart of Research in Motion Limited (RIMM) from June 17, 2011. Notice how leading up to the morning gap the bands were extremely tight.
Tight Bollinger Bands
Now some traders can take the basic trading approach of shorting the stock on the open with the assumption that the amount of energy developed during the tightness of the bands will carry the stock much lower. Another approach is to wait for confirmation of this belief. So, the way to handle this sort of setup is to (1) wait for the candlestick to come back inside of the bollinger bands and (2) make sure there are a few inside bars that do not break the low of the first bar and (3) short on the break of the low of the first candlestick. Based on reading these three requirements you can imagine this does not happen very often in the market, but when it does its something else. The below chart depicts this approach.
Now lets take a look at the same sort of setup, but on the long side. Below is a snap shot of Google from April 26, 2011. Notice how GOOG gapped up over the upper band on the open, had a small retracement back inside of the bands, then later exceeded the high of the first candlestick. These sort of setups can really prove powerful if they end up riding the bands.


