How to build mean reversion trading systems and examples
Post on: 1 Июнь, 2015 No Comment

Share this post:
As a trader, most of my strategies have focussed on the philosophy of trend following. However, over time I have realised that mean reversion trading systems can also be profitable if implemented correctly. Sometimes they may need to be slightly longer in duration and involve some discretionary element in order to work well.
The fact is, financial markets move in cycles. At times they will trend, and trend following strategies will perform best, and at other times they will range and revert back to the mean. Range-bound markets are actually more common than trending markets which means mean reversion strategies usually have higher winning percentages than trend following.
How to build profitable mean reversion trading systems
The first step in building a successful mean reversion strategy is to first agree on what mean reversion is. While trend followers look for trending markets that go on for long periods, mean reversion traders look for markets that are unusually low or high, which will eventually return back to their normal level. Thus mean reversion is about looking for markets that have deviated significantly from their average, which will likely return to the average at some point in the future.
Many types of mean reversion strategies therefore rely on technical indicators to indicate when a market is away from its mean. Moving averages, Bollinger Bands, RSI, MACD and other oscillators can all be used in this way.
The idea of mean reversion can also be applied to fundamentals. For example, stocks generally move in correlation with earnings so if a companys earnings come out substantially above the recent average, its a good bet that next quarter earnings will come back down more in line with the long term average.
Its a similar story for economic concepts such as inflation and economic growth which will often return to the long-term average over time.
Step One – Look for patterns in the data
The first step to building a mean reversion trading system then, is to scan price charts looking for ideas or patterns you might be able to profit from. If you are trading a particular market do you notice any interesting behaviour? Does the market spring back whenever RSI touches an oversold level of 20? Does the market usually come back after its moved 2 standard deviations in the opposite direction?
Step Two – Distill into code
The next step is to get your idea down on to paper in the form of mathematical code. By doing so, you will be able to use a trading program like Amibroker to test that idea on real price data. You could do this by hand but it would be a very lengthy and inefficient use of time.
Step Three – Back-test the code thoroughly
In order to test the code properly youll need to learn a bit about proper system design. In essence, you will want to test the strategy as thoroughly as possible; on different time frames and on different markets. Always make sure to keep a big chunk of data reserved for out of sample testing. You then do your testing on the in-sample data and confirm your system once with the out-of-sample data. If it fails using the out-of-sample data then the system is not robust enough and youll have to start again. Walk-forward analysis is something that you should get to grips with in order to make sure the system will hold up in different market conditions.
Step Four – Paper trade the system
If you go through the steps of proper system design and you end up with a mean reversion strategy you believe to be robust, its important not to rush into the market and start trading it straight away. Take some time to validate on fresh, live data first so that you can be confident that the strategy will work. Because at the end of the day, the only true out-of-sample data is future data. Once you have traded the system on paper for a while and it still works, then you can start applying it with real money.
Step Five – Review the system
If you have a profitable and robust mean reversion strategy, then it should perform in a similar fashion to your previous back-tests. You can use this information to keep an eye on the system and make sure it is behaving as it should be. Keep an eye on the system metrics such as the win to loss ratio, the expectancy, or the drawdown levels. If you experience a drawdown that is significantly larger than any you experienced in back-testing mode, its a sign that the system has broken down.
By the way, you can find lots more useful information about trading systems, including the tools and books I use to help build them in the Resources tab.
Considerations for mean reversion trading systems
One of the major problems with mean reversion trading systems is risk control. A mean reversion trader sees a market that has dropped from the average as cheap; the problem is that if the market continues to drop, it becomes even cheaper. The appropriate response from a mean reversion trader is therefore to continue to buy the market as it falls.
This goes against most principles of risk control since it is not wise to add to a losing position or to try and catch a falling knife.
The response from mean reversion traders is to use different types of exits to trend followers. Time based exits are often used and mean reversion traders usually have rules in place to stop them from adding too many times to an already losing trade.
Of course, another key consideration is the data thats used to test the trading system. It goes without saying that a trading system is only as good as the data its tested on so without good data you cant build a good system. I use Norgate Premium Data which works with a number of different platforms. You can get a free trial of the service here .
Market conditions
Another key consideration for mean reversion traders is the condition in the market. As already mentioned, mean reversion strategies work best in range-bound markets and overall, markets tend to be range-bound around 60% of the time. However, mean reversion systems can fail spectacularly during big trends. It therefore makes sense to have a strategy for when the market is not ranging.
For example, you might want to operate a trend following strategy as well as a mean reversion system or you might have a filter to stop you entering mean reversion trades when the market is trending.
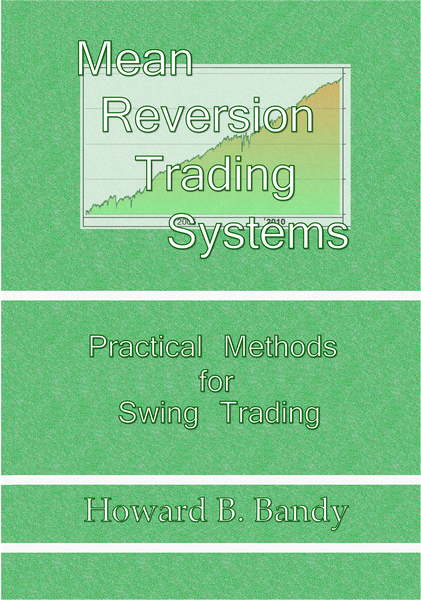
This book by Dr Howard Bandy is good for mean reversion traders. I will say that some of the ideas are pretty complex, and overall the book is geared towards Amibroker users. Nevertheless, its a good addition to the library for serious traders.
Ideas for mean reversion trading systems
• When the market price is greater than the upper Bollinger Band, sell the market
• When the market price is lower than the lower Bollinger Band, buy the market

• When RSI is less than 20, buy the market
• When the commodity channel index (CCI) is above 120, sell the market
• When the commodity channel index (CCI) is less than -120, buy the market
• When the market is 10% higher than the 50 EMA, sell the market
• When the market is 10% lower than the 50 EMA, buy the market
• When the VIX is 20% higher than its two year average, buy the market
• When 5 year EPS of a stock drops 20% below the average, buy the stock
An example from the course
Mean reversion strategies tend to work better on shorter time frames and are thus ideal for swing traders. In my book and course, I cover 20 trading systems, both mean reversion and trend following.
This one is designed using a very simple formula that measures the slope between two recent points on a 24 period exponential moving average (EMA). The Amibroker formula for the indicator is as follows:
GRA = EMA(Open,24) / (EMA (Open,24),-1)
The GRA (gradient) formula therefore measures the steepness of the EMA curve.
A buy position is entered whenever GRA drops below 0.98 as this indicates a significantly oversold condition. Whenever GRA moves back past 1.02 the position is closed.
I tested the system on daily data on S&P 500 stocks between 2000 and 2010 and received a compound annual return of 16.73%. with a maximum drawdown of -47% and 59% winner ratio.
Here is the equity curve:
Subscribe now and get my free eBook and course. No spam, just good stuff.


