How Much Does the Stock Market Actually Return
Post on: 3 Апрель, 2015 No Comment

Modified on December 15th, 2014
This post is graphics-intensive. To see the entire thing, you may have to click the more inside link.
The recent market turmoil has the naybirds out in force, and theyre decrying the long-term viability of stocks. I think this is nonsense. Though I try not to be dogmatic around here, today is an exception. Today I am going to sing the praises of the stock market.
Learning from the experts
When I began to turn my financial life around, I made a habit of reading books about money. The more I read, the clearer certain patterns became. I wrote about these patterns in my very first post about getting rich slowly .
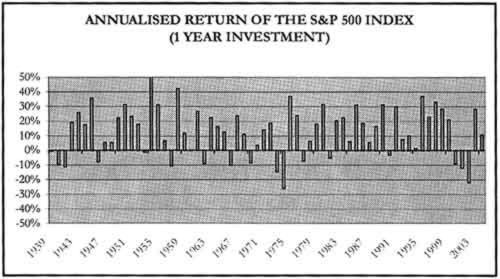
Ive continued to read personal finance books, including books about investing. And Ive continued to detect recurring themes. One of the most prominent themes present in most investing books and present in most conversations with real-life financial planners is that, in the long term, stocks produce attractive returns. They may fluctuate in the short term, and may even decline by 50% in a single year, but historically, they yield an investment return of about 10%.
But Im no financial expert. Im just an average guy who is trying to build his wealth. Lets see what the actual experts have to say. In this post, Ive included excerpts from four of my favorite books about investing.
This book by James Stowers contains some of the most complete information on investment returns that Ive found. And Stowers presents it in interesting ways. Heres what he says about comparing the short term to the long term:

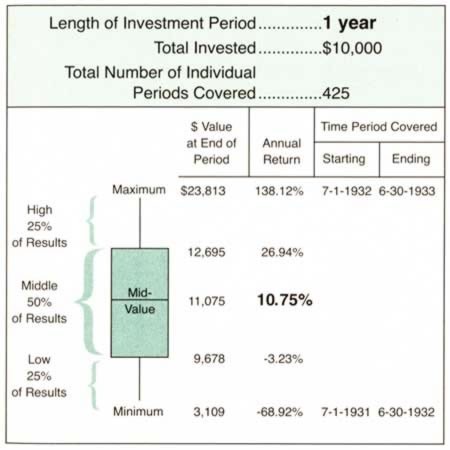
[A $10,000] investment made on 01 July 1932 would have realized, one year later, the worst one-year result out of 425 [periods tested]: minus 69%. Most people, if they had experienced those poor results, would have assumed that this was an indication of future performance and would have become discouraged. Many would have traded their investment back for dollars and tried to find another place to invest their money.
Had they had confidence in the long-term opportunities of the Dow and left their investment undisturbed for another 29 years (30 years total), it would have been worth $556,563. The original investment, which began with the worst one-year result, grew at an average annual compound rate of 14.34% (the best 30-year result). As you can see, it is unwise to assume that short-term investment results are an accurate indication of long-term performance.
The following charts indicate the probability of obtaining a certain return from a $10,000 one-time investment. The top line of each chart indicates the one-year probabilities. So, for example, theres an 55% chance that the S&P 500 Index will produce a 10% return over a one-year period. Theres an 85% chance of obtaining that return over a decade. But, historically, there is a 100% chance of earning that return over a 30-year investment career. (Ignore Fund A its irrelevant to this discussion.)
These next three charts provide snapshots of 1-year, 15-year, and 30-year investments from January 1897 to December 2003. The individual periods have quarterly start dates. Each chart breaks returns into quartiles. Watch how the numbers move to the middle at about 10%.


