Good Stocks To Buy
Post on: 31 Май, 2015 No Comment

Learn how to find good stocks to buy in minutes. In this lesson you will learn how to find the best stocks to buy that can make you 5% to 10% in 1 to 4 days!
Good Stocks To Buy Now
In previous lessons I talked about how to find good stocks to buy now so consider parts of this lesson as a review. I have a degree in education and I know how to teach and reinforce lessons or say them a slightly different way that will help form connections between the synaptic pathways within your brain making memorization of important concepts much easier and almost effortless.
Click Screener up in the top left corner of the screen.
For Market Cap select Small ($300 million to $2 billion). We want small caps because these are the stocks that can really move big with a 1 to 4 day hold time. You can also set this to Micro Cap as in the screen shot above for finding good penny stocks to buy now.
For Beta enter Over 1.5. Beta is calculated using regression analysis. Think of beta as how much a stock responds to swings in the market. A beta of 1 indicates that the stocks price will move with the market. A beta of less than 1 means that the security will be less volatile than the market. A beta of greater than 1 indicates that the stocks price will be more volatile than the market. For example, if a stocks beta is 1.5, its theoretically 50% more volatile than the market. We want high beta because we want stocks that will move 5% to 10% in 1 to 4 days. The best stocks to buy are ones that can make you 5% or more in a few days.
For Price enter Under $10. Good stocks to buy are often ones that are selling at a lower price per share. Once again, stocks priced under $10 have a greater tendency to really move because with a smaller market cap, they are companies that can have revenue increases of 20%, 50% even 80% or more for both quarter over quarter or year over year. You are not likely going to see stocks like Microsoft or Google be able to increase their revenues that much year over year. Large companies like Google and Microsoft have already passed through their greatest growth phase.
For Average Volume enter Over 1M. All good stocks to buy are ones that let you trade in and out of them easily. This setting means stocks that trade 1,000,000 shares or more per day. This is important when trading small caps because you dont want to get trapped in a stock. You want to be able to trade in and out of the stock with ease. The other reason is that professional traders are more likely to buy stocks with greater liquidity and volume greater than 1 million shares per day.
Good Stocks To Buy Right Now
OPTIONAL SETTING: Here is my secret sauce for finding good stocks to buy right now :
Setting the Debt/Equity to Low (<0.1) is going to return a lot less stocks in your screener but, what it will return is absolutely the crème de la crème. What this setting does is that it finds stocks with very low debt. Many times, you will find companies with millions of dollars in cash and zero debt! Companies with a large amount of cash and little debt are usually companies that are well ran. They are good at what they do hence they are making money. They are able to pay for their expenses out of their operating revenues. You know that buying a stock with a large amount of cash and little or no debt means that the odds of you getting blind-sided by a stock offering where a company issues more shares in order to raise cash, is very low. It also means that the company has options available to it like buying a patent or buying another company. But heres the real sweet thing that few people know. It also means that the company is a more attractive buyout candidate by a bigger player within that industry. I stumbled across that truth by accident. I had added companies to my watch list with a low debt/equity ratio and I noticed that they kept being bought out by larger companies. Awesome stuff! Companies with a lot of cash and little or no debt are good stocks to buy today and will be good stocks to buy tomorrow.
Good Oil Stocks To Buy
I am always asked if I know any good oil stocks to buy. You can substitute oil with any industry that is hot right now. At the time of writing this lesson it was oil. Focusing your screen above onto the Independent Oil and Gas industry is simple. With all your settings entered into Finviz above, go to Industry on the top row and select Independent Oil and Gas:
Depending on the industry, you may need to change the Price setting to get more results.
Frequently Asked Questions about Good Stocks To Buy
What debt to equity ratio is good?
A good debt to equity ratio is 0.30 or below. The lower the debt to equity ratio, the better because it means the company has a low amount of debt and therefore has less risk exposure to interest rate increases.
Companies with a very low debt to equity ratio often have a big pile of cash and very little debt.
The debt to equity ratio is calculated as follows:
Debt to Equity Ratio = total debt / shareholder equity
Soni Bros posted the excellent video below called Debt to Equity Ratio.
Preston Pysh posted the great educational video below called Warren Buffetts 1st Rule What is the Current Ratio and the Debt to Equity Ratio.
What are debt equity swaps?
When a company is in financial trouble and needs to do financial restructuring, they sometimes do a debt to equity swap. There are two types of swaps: debt to equity, and equity to debt.
A debt to equity swap is when debt is exchanged for a certain amount of equity (stock) in the company.
A equity to debt swap is when shareholders are given the right to exchange their stock for a cetain amount of debt (bonds) in the company.
APM Marketplace did an awesome educational video explaining capital structure of a business and the role that debt to equity swaps play.
Allen Mursau posted the video below where he goes deep into the accounting of a debt to equity swap.
What is market capitalization and how do you calculate it?
Market capitalization or just market cap, is calculated by taking the total number of shares outstanding, and multiplying it by the current stock price:
Market Capitalization = # of outstanding shares x current share price
Market cap is used to measure a companys size. You will often hear the terms nano cap, micro cap, small cap, mid cap, large cap, and mega cap:
Nano cap = $50 million or less
Micro cap = $50 million to $300 million
Small cap = $300 million to $2 billion
Mid cap = $2 billion to $10 billion
Large cap = $10 billion to $200 billion
Mega cap = $200 billion or greater
Market cap is a way to classify companies by size in order to measure the growth versus risk potential. Generally speaking, companies with a lower market cap tend to have higher growth potential with higher risk, while companies with a higher market cap tend to have slower growth with lower risk. For example, swing traders like the popular Jason Bond will use market capitalization to screen for stocks that are within their growth phase, which tend to be micro and small cap stocks.
If you are going to invest in penny stocks, its very important to understand market cap in terms of valuation. A penny stock that reported revenue of $170,000 last year, and that has 10 million shares outstanding, should trade for roughly $0.017 or $0.02 cents per share; however, if the penny stock company hired a penny stock promoter to pump the stock, the stock could temporarily trade for $0.20 per share or more before crashing back down. If you are a penny stock investor, always compare market cap to total revenue to determine whether a penny stock is overvalued.
Wall Street Survivor posted the excellent video below called Understanding Market Cap.
What determines stock volume?

Stock volume is determined by the number of shares or contracts traded in that stock, over a certain period of time specified by the stock charting software.
Volume can be plotted different ways on the chart but my favorite is the traditional histogram bars along the bottom of a stock chart.
When thinking about what determines stock volume, it might help to think of price as rational, and volume as emotional. Volume tells us the emotional energy (fear or greed) behind a particular price level, in a stock.
Traders put a high value on stock volume in technical analysis studies because volume either supports or denies the price action.
Increased Stock Volume at the Start of a Swing Move
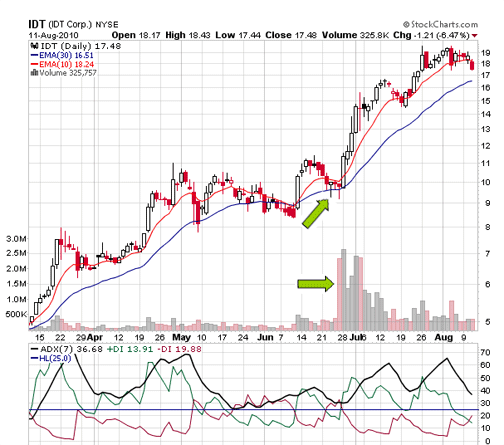
Increased stock volume into an upward or downward price movement suggests that move will continue.
Stock Volume Spike at the End of a Swing Move
If a swing move has already been established and you have a spike in volume, it might mean that the swing is over and a new swing move is about to begin. Not always, but sometimes.
Stock Volume and Price Divergence
Volume either supports or denies price action. When you have falling volume into an upward or downward swing, it might mean that the swing is about to end. Not always, but sometimes.
Marketgauge posted the excellent video below called How to Analyze Stocks Trading on Volume.
Profits234 posted the video below called Stock Volume Analysis that helps you with how to read a volume chart.
Alan Ellman posted the excellent video below showing how he uses volume with the stochastic and MACD.
In the video lesson below you will see how I used the stock screener at Finviz. to find a small cap stock that I made 5% in just 2 trading days.
IF YOU THINK THIS LESSON WAS GOOD, YOU OUGHT TO SEE WHAT JASON BOND (JB) HAS TO OFFER! CLICK HERE TO CHECK OUT HIS SERVICE! HES ON A HOT STREAK RIGHT NOW! DONT YOU WANT TO BE ON A HOT STREAK TOO?
IF YOU THINK THIS LESSON WAS GOOD, YOU OUGHT TO SEE WHAT JASON BOND (JB) HAS TO OFFER! CLICK HERE TO CHECK OUT HIS SERVICE! HES ON A HOT STREAK RIGHT NOW! DONT YOU WANT TO BE ON A HOT STREAK TOO?
Do you have a question about this lesson that is not already covered? Use the form below to send in your question.


