FundaTechnical Analysis
Post on: 18 Апрель, 2015 No Comment

Fundamental Analysis and
Technical Analysis .
- Use a Fundamental Analysis approach to produce a list of companies in which you are happy to invest. Call the list a Watch List. And don’t forget that this list should be revised monthly — perhaps take some companies off the list, and add some companies to the list.
Question. Now does this sound like Sensible Investing ?
But don’t we already do this?
A lot of people will be saying that they already do this. Or the pure chartists will say it’s a waste of time. Or the fundamentalists might say that it is only the fundamentals that matter.
Sure, some people do do this already without thinking about it. But let them be challenged!
I am suggesting here that we use Fundamental Analysis to spot quality stocks for our watchlist. So that we can eliminate the potential losers. Eliminate the over-geared and under performing stocks. And be careful about future projections.
Look keenly at historical performance year-on-year. Things like ROE (or ROC or ROA). And look at gearing levels, because very highly geared companies do run the risk of problems with debt financing when the economy softens or turns sour.
And it is important to use some objectivity and structure in our analysis. And for goodness sake, don’t over complicate it and spend a lot of time on it. Draw the line at some point, and keep it relatively simple.
Fundamental analysis
There is some merit in using fundamental analysis when searching for companies in which to invest. This will help us to invest only in quality companies that should be able to stay around for the long term, and which should be able to produce acceptable returns on an ongoing basis.
BUT! there is a limit to how much we can rely on fundamental analysis. Many people used nothing but fundamental analysis during the GFC period (Global Financial Crisis of 2008-2009 ), and look at the results! Some people lost a significant portion of their savings.
Some of the more successful investors use between 5% and 50% fundamental analysis for their investing decisions.
Technical analysis (charting)
Now before the uninitiated laugh and scoff, this is worth reading (and it really has nothing to do with tea leaves).
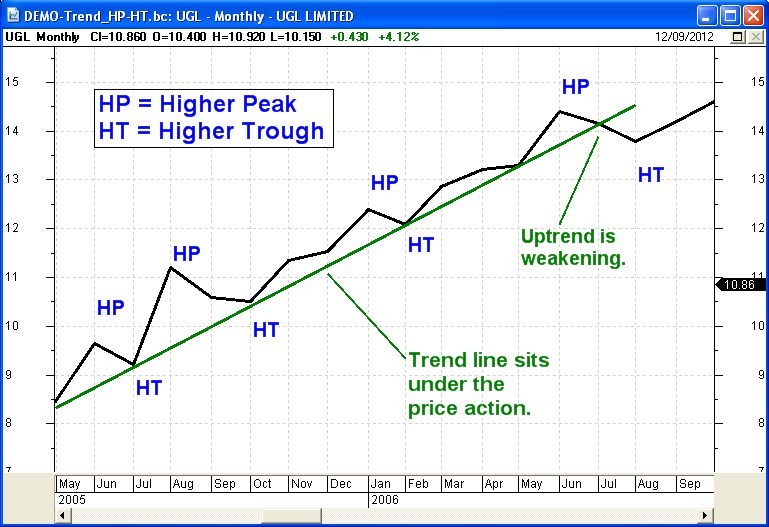
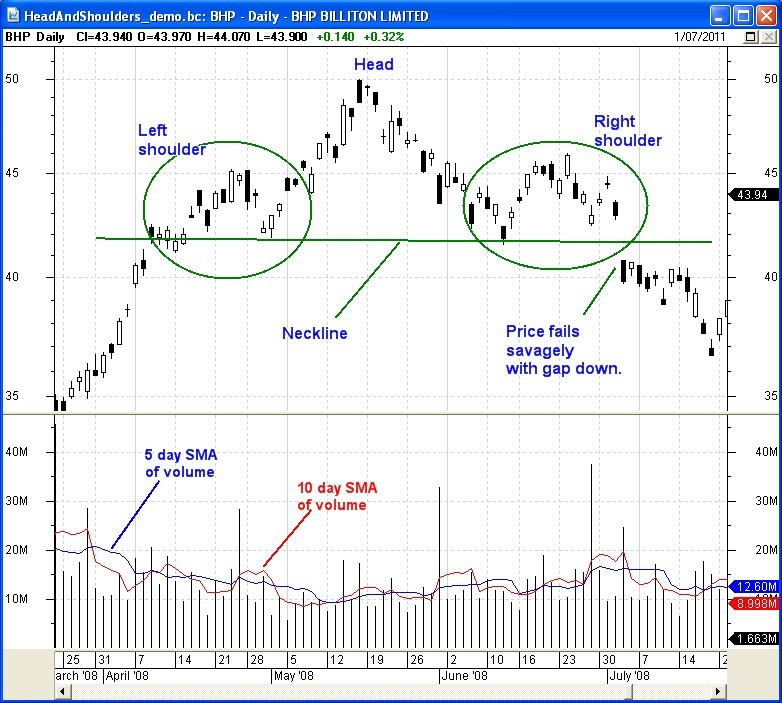
Note that Technical Analysis is the study of price charts in anticipation of future price movements. It can be said that price charts do reflect the mood and sentiment of the share market, and they also reflect all known news about the company (well, almost all known news).
Many technical analysts (chartists) who properly analysed the market and properly followed proven strategies during the GFC of 2008-9 actually made profits during the down turn when others were making losses. So, there is a great degree of merit in Technical Analysis. Some of the more successful investors/traders use between 50% and 95% technical analysis for their investing decisions.

Logical conclusion — Funda-Technical Analysis
It seems most sensible that a combination of Fundamental Analysis and Technical Analysis could be very beneficial — let’s call it Funda-Technical Analysis . The Funda comes first, because it is the first thing we do in this process, and the Technical comes second because we apply this analysis to the stocks in our watchlist that came out of the Fundamental Analysis.
Some people might suggest to select stocks using charts, and then apply the fundamental analysis approach. This really seems to be putting the cart before the horse. Do the Fundamental Analysis first and produce the Watch List. This will not change much from month to month; but it might change significantly in each half-yearly reporting season.
And — Be aware of the state of the market
I have already written some material about the Key Lessons from the Global Financial Crisis for the future benefit of investors and traders. It carries the sub-title Beware the Bears (they are never far away) .
You can see that material on this web page. And the PowerPoint slides from an updated presentation of the same name.
And also be aware of the Brainy’s 3Ways Rule (in 3Times) to help you understand the state of the market, and the different trends that can be in play.
The Funda-Technical Analysis logo
The specially designed Funda-Technical Analysis (FTA) logo has the following key elements:
- The two letters F and T are intertwined to remind us that both approaches are key parts of the strategy.
- The top of the letter T represents a 5-wave upward trend (representative of healthy uptrends), to remind us that we have an increased chance of success if we follow a sensible strategy based on uptrends.
- There are clues imbedded within the lines of the letter F to remind us of the three key elements of Fundamental Analysis (more details in the Members Area ).
Okay, so exactly which Fundamental Analysis criteria should we use to prepare our watchlist?
Well, it might be some or all of the following: Return on Equity (ROE), Return on Assets (ROA), Return on Shareholder Funds, P/E, P/E Growth, Debt to Equity ratio, Dividend per Share (DPS) or Revenue Growth.


