Finding Value With PEG Ratio
Post on: 3 Июнь, 2015 No Comment

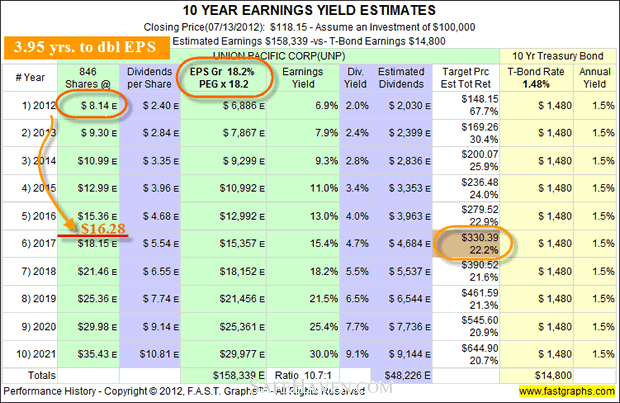
Speaking of stock valuation, many are familiar with the popular price-to-earnings (P/E) ratio, which is widely used to compare the relative value of stocks by taking the current share price and dividing it by its earnings per share (EPS). Taking an additional step in dividing the P/E ratio by the earnings growth rate, we get the price/earnings-to-growth (PEG) ratio, which incorporates the company’s earnings performance.
The ratio is popularized by renowned investor Peter Lynch. He quoted in his book ‘One Up On Wall Street’ that “the P/E ratio of any company that’s fairly priced will equal its growth rate”. That means, a company with a PEG ratio equal to 1 will be considered fairly valued.
Exemplifying PEG Ratio
Let us illustrate by comparing the PEG ratios of two companies: Company A, a manufacturer of convenience food and beverages, against its larger peer Company B. Calculating the PEG ratio with 5-year EPS growth rate:
*5-year EPS Compound Annual Growth Rate (CAGR) – FY05 to FY10
From the table above, Company B with a higher P/E ratio of 18.8, appears to be priced above its growth performance, arriving at a PEG ratio of 1.38. Comparatively, Company A appears deeply undervalued with a PEG ratio greatly below the fair value of 1.
Akin to calculating the P/E ratio, the methods used in computing the EPS growth rate could be forward-looking (projected estimates), trailing (above example using historical data), or any kind of average of the two. The result varies using earnings growth rate from different time periods. A longer period (e.g. 10-year EPS CAGR) is more effective in smoothing the volatility caused by business cycles and economic fluctuations, compared to a shorter period (e.g. 3-year EPS CAGR).
Added Thoughts In Using PEG Valuation
The calculation of the EPS growth rate is subjective when computed with the forward-looking method, noting that earnings estimates made by the company itself may be optimistically biased. Good projected estimates may be hard to find for less popular companies, as analyst coverage could be thin. Be consistent in using the sources with the same calculation method when making comparison between companies.
Taking into account that the PEG ratio does not incorporate distribution income, the valuation ratio is less relevant for measuring highly established large corporations that constantly give investors reliable dividends, but with little growth opportunity. As such, the PEG ratio is highly recommended for stocks with little or no dividend yield.
Summing up, the PEG valuation method is easy to use and it provides more insights and a bigger picture than the P/E ratio. Nonetheless, thorough research is required when analyzing a stock in understanding its business operations and management team as well as its peers and business environment.


