Finance And Trading Terms Explained What Is A HeadandShoulders Pattern
Post on: 9 Июнь, 2015 No Comment

Stay Connected
Even professional traders and investors can’t always speak the language of colleagues working in a different segment of the financial world. With that in mind, we’ve introduced this weekly column, looking at one esoteric or potentially misunderstood finance or trading term every week. After bringing you carry trade , contango , and reflation in past columns, we’ll now focus on a term from the world of technical trading: the head-and-shoulders pattern, sometimes shortened to HASP.
What Exactly Is the Head-and-Shoulders Pattern?
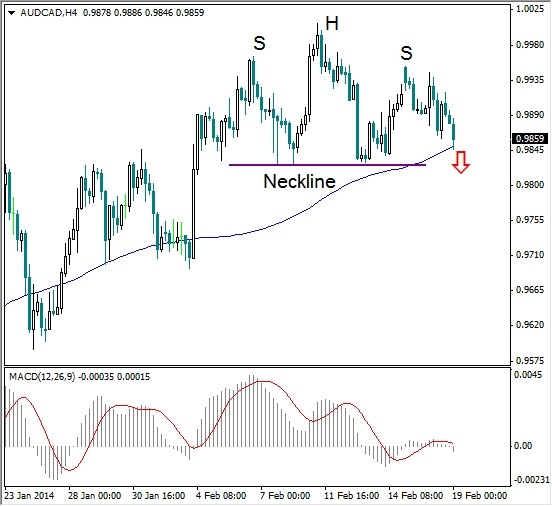
The short answer: It’s a pattern in an asset’s price movement that literally looks like a head and shoulders on the asset’s price chart. The pattern is important to traders because it generally signals a drop in price. We asked Braden Perry, COO of the broker dealer Kennyhertz Perry, to help explain what this means. As he told us, The general head-and-shoulders pattern begins with the left shoulder, which includes a price increase, peak, and then decrease. The head begins on the following price increase forming a higher peak, then is followed by the right shoulder, showing a lower price peak.
Below is an illustration of this pattern:
Source: ChartAdvisor.com
A reverse head-and-shoulders pattern can also happen, where a bottom head and shoulders signals that a price increase will likely be the ultimate outcome. Below is an illustration of the reverse head-and-shoulders pattern:
Source: Chartpatterns.com
How Can Traders Profit From the Head-and-Shoulders Pattern?
To give an example, a trader will watch for patterns like the head and shoulders to form in an asset stock of, say, Apple (NASDAQ:AAPL ). When a head-and-shoulders pattern does form, a trader can assume that the value of Apple’s stock is going to decrease upon the completion of the pattern. So the trader will short-sell Apple stock to make a profit. Conversely, another trader watching for patterns in, say, Google (NASDAQ:GOOG ) may notice a reverse head and shoulders and buy shares of Google, expecting the stocks price to increase.
There’s no defined time frame for the pattern, meaning it can occur over a course of days or months. Many day traders and short-term traders utilize the pattern, as well as technical and long-term investors, said Perry.
Can the Head-and-Shoulders Pattern Be Relied Upon?
The head-and-shoulders pattern is one of the more reliable [indicators], both in reversals and in uptrends, in traditional equity stocks, but it has been recently invalidated by several commodity stocks, including silver and platinum, said Perry.
However, some consider the reverse head-and-shoulders pattern to be weaker than the standard HASP. In his book How to Make Money in Stocks. William O’Neil, the founder and chairman of Investor’s Business Daily. says, A head-and-shoulders bottom may succeed in a few instances, but it has no strong prior uptrend, which is essential for most powerful market leaders.
Still, O’Neil admits that the head-and-shoulders top is one of the most accurate patterns that a trader can use. One mistake that’s sometimes made, however, is that some traders don’t pay close enough attention to the shoulders. Watch carefully where the shoulders form, said Paul Whitfield, an Investor’s Business Daily writer. The right (second) shoulder must be slightly below the left shoulder. A lower right or second shoulder is much more indicative of a downward trend than when it is higher.
Whitfield also takes issue with the so-called neckline, a trend line that’s sometimes drawn touching the lows of the pattern. In a case where a neckline is used (see the image above of the inverted head-and-shoulders pattern), the trader shorts the asset when its price drops below the neckline. On this error, Whitfield writes, This, however, is an obvious signal and sometimes doesn’t work. Instead, it more often pays off to wait until the stock has made a sharp break below its 50-day moving average. Usually this occurs after attempting a few rallies back above the 50-day line. Most trading platforms will allow you to place an asset’s 50-day moving average on the same chart as its price, for comparison.
Click here for an illustration of Whitfield’s point on a price chart for Alexander and Alexander Services, an insurance brokerage firm that was acquired by Aon (NYSE:AON ) in 1996.
Why Exactly Does the Head-and-Shoulders Pattern Offer a Signal That an Asset Price Will Drop?
It’s not stock market trading magic, so what is it? As Braden Perry told us, Its pattern follows the natural rationale that there are bullish and bearish trends, and this is a microcosm of the markets generally.
The head-and-shoulders pattern works because it signals a top to an asset price, a ceiling through which the price of that asset is not likely to rise. The top is the beginning of a downtrend, so traders can be fairly confident that a proper head-and-shoulders pattern is signaling a drop in price.


