Fibonacci Trading_2
Post on: 7 Август, 2015 No Comment

15 Flares Twitter 1 Facebook 13 Google+ 1 Filament.io More Info ‘> 15 Flares
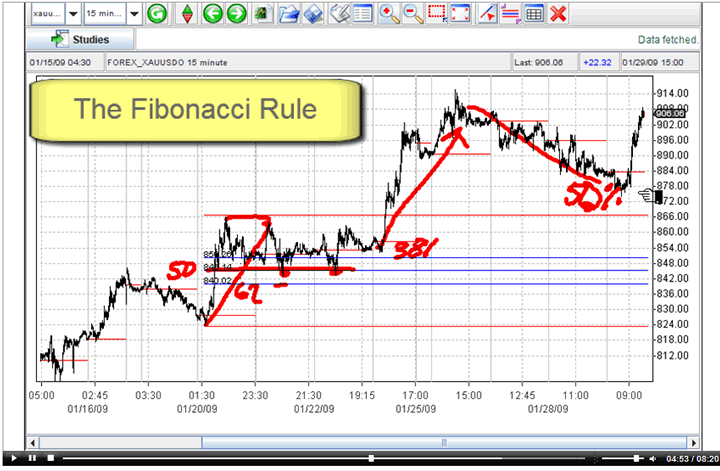
Fibonacci ratios, when applied to trading stocks, correlate two trends; lets refer to them as primary and secondary. The primary trend refers to a trending move in one direction while the secondary trend will refer to counter trend moves in the opposite direction. The three most common fibonacci retracement levels are 38.2%, 50%, and 61.8% of the primary trend and most basic stock charting applications will use these as standard levels. These fibonacci retracement levels act almost as magnets once the counter trend rally takes place. These are very common, however, there are a few other fibonacci levels that can provide resistance. These are the 75%, 78.6%, 87.5%, and 88.7% retracement levels. The common rule of thumb is that when the 50% retracement level is taken out, the four levels I just mentioned become magnets to attract price. Price action must be analyzed at those levels to understand if the countertrend move will cease or whether it will continue to fully retrace the primary move.
Fibonacci retracement levels are used by many floor traders and therefore become very relevant to your fibonacci trading activities. These levels are so widely used now by traders, including systematic trading, that they almost become a self-fulfilling prophecy. Some advanced traders will take it a step further and add fibonacci arcs and fibonacci fans to their trading arsenal, in search of an edge.
Defining the Primary Trend
Lets start with the characteristics of the primary trend of which we would want to play the countertrend. I found that fibonacci retracement levels are most accurate after the primary trend has been a sharp move in price accompanied by heavy volume at the end of that move. These types of moves typically exist in the story stocks of the day or the appear on the list of highest percentage gainers or losers list which complements my trading style as these are the only stocks that I will trade.
I am asked many times how to define the starting and ending points in order to calculate the length of the primary trend. I see many traders make the mistake of using the highest point and lowest point of a trending move to define the starting and ending point of the primary trend. While this may work in some cases, it is best to look for double tops or double bottoms when locating your starting and ending points. This may or may not coincide with the highs or lows of the move.
How to Use Fibonacci Levels
I do not use fibonacci levels as a primary trading technique, however, I found that it greatly improves my odds of generating a winning trade when fibonacci retracement levels start correlating with price objectives using other patterns, such as candlestick charting formations for example. I use fibonacci levels in two ways:
1) After identifying the primary trend, use price reversal pattern recognition (through candlesticks or any other trading technique that you employ) to coincide with a fibonacci retracement level to confirm that the countertrend move has ceased. I then look for the stock to test the recent lows and double bottom or break through that level. That is where I employ the usage of tape reading to determine whether I should play the double top/bottom or whether I should play a breakout in the direction of the primary trend.
2) Many times, a stock will spike down on high volume and that will signal capitulation and put a floor in the market. Usually, an automatic rally will ensue and fail when the dip buyers lose their buying pressure. Oddly enough, this coincides with fibonacci retracement levels (usually 38.2% or 50%). Once that rally kicks in, a retest of the recent lows will be attempted and a trading range can be created between the lows that were put in with spike volume and the highs of the automatic rally. This trading range carries on for a bit of time before a breakout up through the range occurs. This breakout can be bought with good tape action and then the tape action must be hawked as well as keeping an eye on fibonacci levels which could act as resistance. If I see buying pressure fizzling out at one of the key fibonacci levels mentioned above, I get out of the trade immediately.
As you can see, fibonacci trading is a secondary part of my game but a pivotal one. You can really hit the sweet spot in trading if you can combine a few key trading elements together and design your own trading system where you put the odds in your favor. The bottom line, you probably shouldnt leave fibonacci retracement levels out of that mix.


