Fibonacci Retracements Levels Guide
Post on: 7 Август, 2015 No Comment

But what is Fibonacci ?
Basically, in 12th century, an Italian mathematician named Lenoando Pisano nicknamed Fiboancci, son of Guglielmo, discovered a number sequence revolved around numbers that repeat themselves into the nature.
The fibonacci numbers sequence begin with 0,1. If you keep adding the previous number together you will get a series of numbers
0,1,1,2,3,5,8,13,21,34,55,89,144. etc.
Eventually with bigger numbers, one will divide into it’s successor 1.618 times. This is known as Golden Ratio, and with it’s reciprocal,0.618. These two numbers are found repeatedly in nature, history, science and human activities.
There is an interesting article on these fibonacci discoveries.
How do we trade these fibonacci numbers ?
It’s beyond the scope of this page to get into all the details, but when you divide certain fibonacci numbers together in the fibonacci sequence. you get a certain percentages.
The most commonly used percentages are:
Quite often stocks retrace into these fibonacci retracement levels before reversing or continue its trend. Normally when it retraces less than 50%, it tends to continue in the same direction after a small pause.
When you can’t find any support and resistance levels across the chart. then these fibonacci retracements levels are your guide.
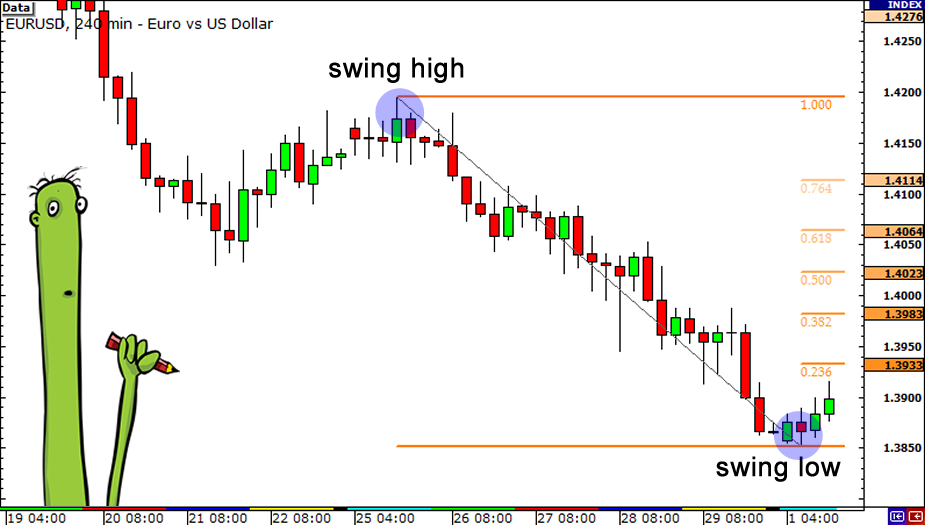
Most of stock trading charting softwares can draw these fib retracement level lines. Basically you draw the lines from one peak to another bottom and it will display the fibonacci retracement percentages lines across the chart.
Price Retracement Personalities
Price series tend to have their own personalities. I found currencies and major indexes like S&P500 tend to like the golden ratio, 1.618. 0.618, 2.618 quite a lot. So keep an eye on the one you intend to trade to see if there is a pattern repeating all the time.
The S&P 500 chart shows an example of what I am talking about. Note, when you have two or more fibonacci retracements levels hitting the same place, there is a strong tendency that price will reverse at that level which happened in our case.
In the top half left hand corner, I drew fibonacci lines from top of the hourly bar from 9th April to the bottom of the low bar on 8th April and it produced a few fibonacci lines downward, mainly 161.8 ( 2nd dotted line from bottom)and 261.8%.
See how S&P 500 bounced off this golden ratio 161.8% twice. So if you are day trading, please take note. It then ran into resistance at 50 (2nd dotted line from the top)& 61.8% ( 3rd dotted line from the top) before reversing down again.
This 50 and 61.8% conincide with the golden ratio 161.8% again if you draw the fibonacci retracement lines from the top of this little peak to the bottom of the this little double bottom as shown below.
Also do you notice there are lots of chart patterns on this chart. Cup and handle pattern (lower part ok), and the latest cup and handle pattern seems to be failing and now looks like head and shoulder forming if you draw a trend line touching the low of 18, 22 and 23. Possible more downturn if it breaks the line and don’t come back up!
Fibonacci Retracements Calculations
- Work out the difference between the peak and bottom of the price
Fibonacci trading is the starting tool for predicting future market turning point. It also works on time as well. I use fibonacci time and price retracements level in conjunction with Elliott waves, delta, and market matrix to find stock market turning points.
I use Dynamic Traders software — Time and Price Prediction for this. Although it’s not cheap, it’s a great tool (and great education Elliott wave course as well !) for doing your own technical analysis for predicting future turning points.
I have recovered the cost of software many times
Other Fibonacci Trading Software
You may be interested in this cheaper stock market timing software based on Ganns and fibonacci retracements.
It’s quite easy software to use. You just enter the price and date, the software will return a potential reversal date .
Although I have not used it as I have dynamic trader already, I thought it may benefit you so I have included in here.
Recommended Fibonacci Retracements Trading Training Video
Fibmaster Fibonacci Trading Videos — If you want to know more than what I have shown you, then you can watch these videos which guide you through, step-by-step and show you how to predetermine the high and low, how to enter and exit the trade, which fibonacci retracement levels are likely to turn the market and many more from this training video.
Fibonacci Retracements Ebook
If you really want to get into how to project fibonacci time, price and also combine with Elliott Wave to see where one wave starts and ends, then this ebook is really good for you.
This ebook also teaches you how to use Fibonacci time periods to anticipate trend reversals and more.
It is written by Wayne Gorman who has 25 years experience in trading, forecasting, and portfolio management. He also worked for Citibank and Westpac Banking Corporation and now working at Elliott Wave International.
Recommended Fibonacci Time And Price Retracements Book
I came across this book by Carolyn Boroden
Fibonacci Trading: How to Master the Time and Price Advantage
available in UK via above amazon.co.uk link. The author went in length in explaining how to predict probable turning points using a cluster of price and time. The whole book is full of charts with fibonaci retracements levels. There is a section on how to prepare for entering and exiting the trade using fibonacci retracement time and price.
Click on above link for the book for UK if you want to learn more on fibonacci trading. Click on the below link for fibonacci trading book in United State


