Equities Blending technical and fundamental analysis
Post on: 18 Апрель, 2015 No Comment

Fundamental equity traders rely on factors such as earnings, earnings growth or valuation ratios to select securities. Technical traders use moving averages, trading volume patterns or price breakouts.
One method is not necessarily better than the other; each has its merits. By leveraging the strengths of both of these styles, we can not only increase our success rate in selecting securities, but also improve our portfolio management.
To understand the nuances of the two methods, it helps to think of a company and its stock as two separate entities. For the most part, fundamental analysis dissects the company, its business and its financial statements. Technical analysis focuses on changes in the companys stock price and volume. Integrating fundamental and technical analysis helps investors see a holistic picture of the investment opportunity.
Here, we will use the stocks of two companies to illustrate how fundamental and technical analysis can be combined to select securities, make weighting decisions and determine entry points.
Sound fundamentals
Lets examine the energy sector. First, well screen companies using fundamental criteria, including the most recent quarters earnings surprise, 12-month expected earnings per share (EPS) growth and the forward P/E multiple. BP and Marathon Oil are among the companies that comfortably pass the management execution, growth and valuation criteria (see Fundamental litmus test, above).
Both BP and Marathon Oil are executing well as evident from positive earnings surprises. Over the next 12 months, the companies are expected to increase EPS at a relatively rapid clip. For fundamentalists looking to buy shares of growing companies at a reasonable price, BP and Marathon Oil look quite attractive. These shares trade at relatively modest forward P/E multiples. In fact, the forward P/E multiples are lower than the expected EPS growth rate.
Technical dissection
Three types of technical indicators are commonly used to get a handle on the technical picture (see Technical overview.) They are:
Trend indicators, such as moving averages and moving average convergence/divergence (MACD)
Momentum indicators, such as the relative strength index (RSI)
Volume indicators, such as Chaikin money flow (CMF)
Now, lets examine how BP and Marathon stack up on these technical indicators. For BP, refer to the chart Bouncing higher.
1) BPs share price chart shows that the stock is on an uptrend. The 50-day and 200-day simple moving averages (SMA) are both nicely moving higher. The MACD line is above zero, confirming the uptrend.
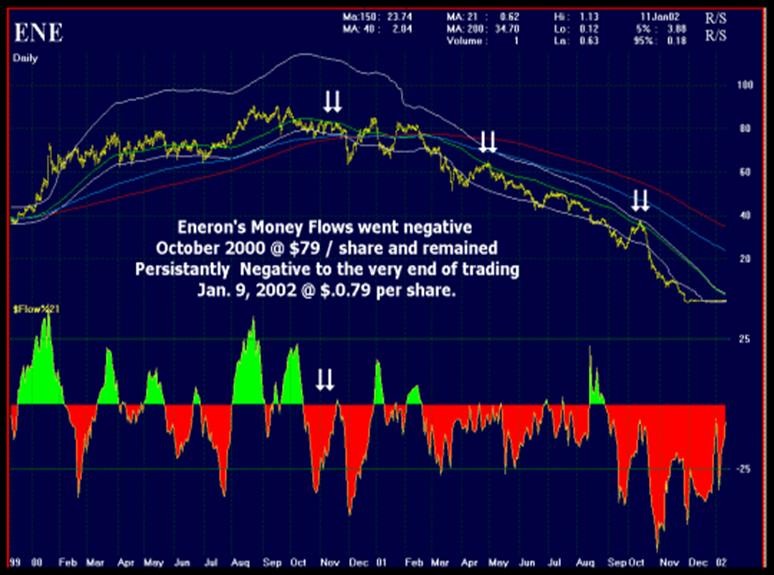
2) The green-shaded area exceeds the red-shaded area under the CMF panel. This suggests that BP shares are under buying pressure for some time. This raises the probability of the uptrend extending into the future.
3) The RSI reading of 69.37 is close to 70.00, suggesting an overbought condition. As such, a correction in BP shares could ensue at any point.


