Emerging Markets ETFs EEM v Comparison
Post on: 7 Апрель, 2015 No Comment

One of the hottest asset classes in 2009 by far was Emerging Markets, which includes stocks from developing markets like China, Brazil, Korea, Taiwan, India, and South Africa. Two of the most popular ETFs in this category are the iShares MSCI Emerging Markets Index (EEM ) and the Vanguard Emerging Markets ETF (VWO ).
Which one should you choose?
Similarities. Both are primarily passively-managed and based on the MSCI Emerging Markets Index. EEM has been around longer but both currently have similar levels of assets, with $40B for EEM and $34B for VWO.
Differences. EEM is less expensive than most other actively-managed Emerging Markets mutual funds at a 0.72% annual expense ratio, but Vanguard is significantly cheaper still at 0.27%. EEM has a much higher average trading volume, as it has a higher popularity amongst institutional investors and active traders.
While they track the same index, both ETFs have their own sampling methods to replicate that index. EEM holds 439 stocks with an average market cap of $23.1 million, while VWO holds 816 stocks with an average market cap of $17.6 million. Unfortunately, Morningstar chose the MSCI EAFA Index as their benchmark for statistical comparison, so its hard to see exactly historically which one has been following the index more closely.
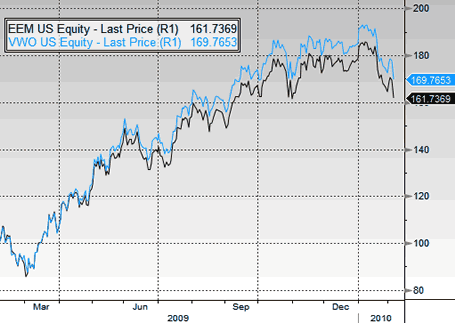
Performance-wise, iShares EEM has recently been lagging behind Vanguard, as was pointed out in this IndexUniverse post. In 2009, EEM rose 68.8% but VWO gained 76.3%, nearly 8 percentage points more.
This has led to a significant outflow of funds recently from EEM into VWO:

However, if we look back to 2008 EEM dropped 48.9% while VWO dropped 52.5%. VWO isnt old enough to compare 5- or 10-year historical returns, but if you compare 3-year annualized trailing returns VWO only beats EEM slightly at 2.69% vs. 2.60%. Thats actually surprising given the 45 basis point expense edge for VWO.
Conclusion. Due to their differences, either EEM or VWO may outperform each other in the short run. However, historically the significantly lower expense ratio of VWO has won out, and I would expect it continue to do so in the long run. VWO also holds more stocks and thus would seem to track the MSCI index more closely, while EEM offers more liquidity if youre trading high amounts of shares at once.
Disclosure: I am or will be invested in VWO or the mutual fund equivalent (VEIEX). The reason I started this research is because I am currently trying to figure out how to switch to an ETF since the Vanguard fund VEIEX is both more expensive at 0.39% annually and has both a purchase fee of 0.50% and a redemption fee of 0.25%. Ouch! You can compare the total ongoing costs of VWO vs. VEIEX easily at this Vanguard calculator .


