Elliott Wave Trading Software Track n Trade
Post on: 23 Май, 2015 No Comment

Award-Winning Elliott Wave Trading Software
**This video is for demonstration purposes only and is not a recommendation to buy or sell any particular financial instrument. There is risk of loss trading Stocks, Futures, Forex, or Options.
Track n Trade is the Ultimate Elliott Wave Trading Platform
I want to give you a couple of examples of how you can integrate Track n Trades many different unique Elliott Wave tools into your own trading strategy to help give you an overall more robust trading system.
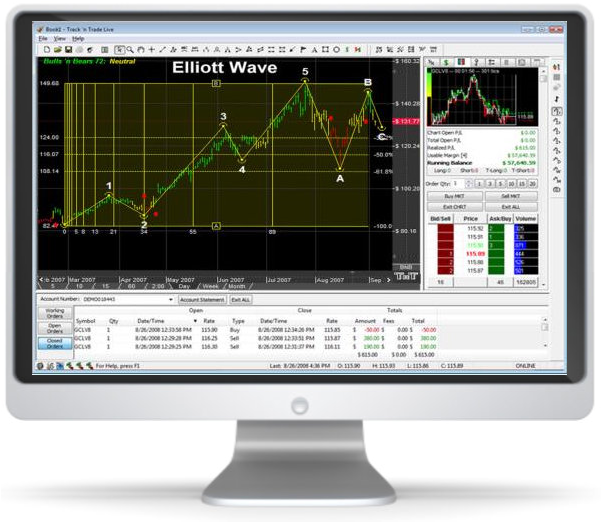
Track n Trade employs several Elliott Wave tools for identifying and charting the Elliott Wave, both manually as well as mathematically system automated.
Manually Identifying An Elliott Wave Trend
This is done simply by clicking on the icon, and loading the cursor with the Elliott Wave analysis tool, then clicking on the highs and lows of the wave formation. Traditional chart technicians love our free floating tools because it gives them complete control over how they perform their Elliott Wave chart analysis, the points can be manually adjusted and labeled as the market moves through price and time.
Automatically & Mathematically Identifying The Elliott Wave
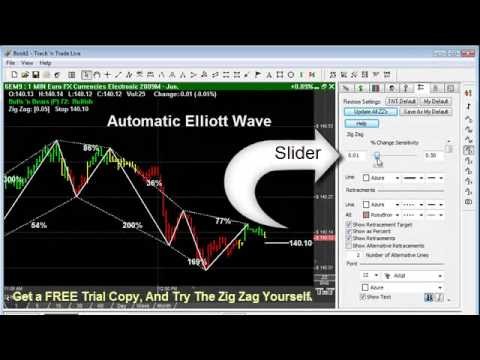
Now, while many technicians enjoy using our manual drawing and calculation tools, other market technicians choose to have the mathematics of the computer identify the trend for them; in Track n Trade, this is accomplished through a tool called the Zig Zag system. This Elliott Wave indicator integrates the Elliott Wave tool with the Fibonacci retracement and projection levels.
Auto-calculate Elliott Wave projections, extensions and retracements.**
Simply by turning on the Zig Zag system, you see that it automatically identifies the Elliott Wave trends of the market based on any level of sensitivity you provide through a simple slider interface. As you slide the sensitivity level higher or lower, the software automatically recalculates each point within the market, and regenerates new Elliott Wave formations, along with their corresponding Fibonacci projection and retracement levels. Also notice the retracement target, this projection level is effectively the mathematically calculated price target from which you can execute your Elliott Wave trading strategy from. Once the market reaches this price target, based on the sensitivity youve selected, the system recalculates and automatically generates the next new price point and subsequent retracement and projection levels; many traders use this point as an initial price target.
Automatically Color Coded Fibonacci & Elliott Wave Trends
And finally, the Bulls n Bears Trading System . For many traders, learning all the rules designed around Fibonacci and Elliott Wave gets just a bit overwhelming, so we have taken the entire concept of Fibonacci integration, Elliott Wave pattern recognition, projections and extensions, and integrated them all into one simple trading system known as the Bulls n Bears. We actually calculate for you all the relationships between each system, Fibonacci, Elliott Wave, Price, and Time projections, and then we color code those systems in a fashion that makes it very simple and easy to understand.
We identify the Fibonacci and Elliott Wave projection and extension levels by turning the color of the price bars green, we identify the Fibonacci and Elliott Wave retracement extension levels by turning the color of the price bars red, and we also identify the neutral points between the two projection and retracement levels as yellow.**
Elliott Wave in combination with Bulls ‘n Bears calculates bullish, bearish, neutral markets.**

Notice in this example, as the market price projects out in time, the advancing market chart is highlighted in Green, as it makes a pull back to the Fibonacci retracement levels, it changes color to yellow, and as it begins to make a complete retracement calculation, the color changes to red. We also identify the Elliott Wave & Fibonacci price levels with market momentum arrows, highlighted here. The general rule for using the Bulls n Bears Fibonacci Elliott Wave system, is to take a long position as the market advances out of the neutral or yellow zone into green, and to take short positions as the market retraces from yellow into red.
Hyperbolically Linked Mathematically Calculated Trailing Stops
As an added bonus, weve also hyperbolically linked a mathematically calculated trailing stop system into the Bulls n Bears, which helps us identify mathematically calculated areas of support and resistance for adding our trailing stops, based on guidelines from top Elliott Wave and Fibonacci Strategists .
Bulls ‘n Bears automatically calculates trailing stop placement using Elliott Wave retracements.**
Track n Trade is truly the Cadillac of Elliott Wave and Fibonacci Trading Software
And, weve only just touched on the highlights of what all can be done within this amazing piece of software. Download your free trial copy of Track n Trade now, theres no cost or obligation, nor do we require a credit card to give it a test drive. Once youve installed the software, watch the above video again, and follow along with me as I show off, Track n Trade, The Ultimate Elliott Wave Trading Machine.


