Elliott Wave Analysis Stock Market Prediction Patterns using 8Waves
Post on: 16 Март, 2015 No Comment

History repeats itself. It is no different in the marketplace. Ralph Nelson Elliott observed this same phenomenon in the price movements of stocks in the 1930s. As an accountant, Elliott was very familiar with number patterns. Because of his insight into mathematical patterns and his interest in the stock market, Elliott was soon to recognize that price movements in the marketplace also mimic the patterns of everyday occurrences that can be modeled through mathematical equations. He investigated price movements of stocks and concluded that patterns based on mathematical models do exist in the financial world. Furthermore, these patterns do repeat themselves. He provided proof of his discovery by making incredibly precise stock market predictions. Elliott proclaimed that the market can be a predictable place because it follows established patterns. Despite the seemingly random movements within the markets, Elliott showed that mathematical models can be formulated to map out the patterns of the market. All you need is to just look for these patterns in the charts. Elliott called his discovery The Elliott Wave Principle. Elliott had found the common thread that drives the trends in human behaviors, from financial markets to fashion, from politics to popular culture.
For many years after Elliott’s discovery, the elliott wave principle was confined to the dark crevasses of library books. It wasn’t until the 1970s when Robert Prechter finally rediscovered its significance and its ability in predicting market behavior. In 1978, Robert Prechter and A.J. Frost published the Elliott Wave Principle and reinvigorated a new generation of traders and investors. The book was a big hit and shortly became a bestseller on Wall Street. In Elliott Wave Principle, Prechter and Frost’s predicted for a powerful bull market to start in the 1980s, to be followed by an extremely bearish market. That scenario played out as predicted and by the turn of the century, the elliott wave principle was deeply entrenched as a valuable tool in forecasting market fluctuations.
Investors began seeing great value in elliott wave analysis for predicting market moves. Interests in learning the Wave Principle among professional investors soon grew rapidly in the 1980s and 1990s. As more traders began to understand that the natural rhythmic behavior of the universe also plays out in the world of finance, the wave principle was soon adopted as a valuable instrument in their trading arsenal.
Elliott Wave Patterns
Just like any system or structure found in nature, the closer you look at wave patterns, the more structured complexity you see. It is structured, because natures patterns build on themselves, creating similar forms at progressively larger sizes. You can see these fractal patterns in botany, geography, physiology, and the things humans create, like roads, residential subdivisions and as recent discoveries have confirmed in market prices. Natural systems, including Elliott wave patterns in market charts, grow through time, and their forms are defined by interruptions to that growth.
As an analogy to the dynamic wave patterns identified by the elliott wave principle, you can imagine the subtle growing stages of a human fetus. When your hands formed in the womb, they first looked like round paddles growing equally in all directions. Then, in the places between your fingers, cells ceased growing or died, and growth was directed to the five digits. This structured progress and regress is essential to all forms of growth. That this punctuated growth appears in market data is only natural as Robert Prechter, the world’s foremost Elliott wave expert and president of Elliott Wave International, says, Everything that thrives must have setbacks.
Elliott Wave Analysis
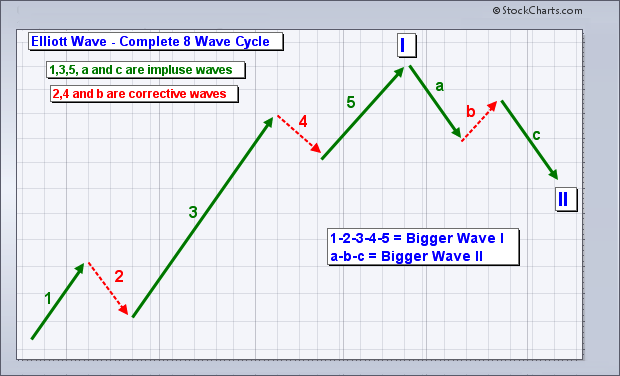
The first step in Elliott wave analysis is identifying patterns in market prices. At their core, wave patterns are not that complex since only two types exist: impulse waves, and corrective waves. Impulse waves make up the main waves and define the trend of the market. Impulse waves contain 5 sub-waves and are identified as wave1, wave2, wave3, wave4, and wave5. Impulse waves are called so because they powerfully impel the market. Upon completion of wave5 a market correction ensues. The corrective period that follows wave5 consists of three sub-waves. The corrective waves move counter to the main trend and are identified as WaveA, WaveB and WaveC. Corrective waves achieve only a partial retracement, or correction, of the progress completed by any preceding impulse wave. As shown in the the above figure, one complete Elliott wave consists of eight waves that are divided into two phases: a 5-wave impulse phase, whose sub-waves are denoted by numbers, and a 3-wave corrective phase, whose sub-waves are denoted by letters. What R.N. Elliott set out to explain using the Elliott Wave Principle was how the market actually behaves. There are a number of specific variations on the underlying theme, which Elliott meticulously described and illustrated. Elliott also emphasized that the waves within each phase will have different signatures and can be uniquely identified. From these discoveries, he was able to derive a group of core rules and guidelines for accurate wave identification. A thorough understanding of such details is essential predicting what the markets will do. And just as important, what the market will not do.

Make no mistake. The Elliott Wave Principle can be complex and can be difficult to master. But once you understand the underlying philosophy and the basic mechanics involved in the 8 waves, the power to forecast the markets is within your grasp. This page is only a precursor to the power of elliott wave analysis. Refer to Elliott Wave International for more detailed education on the Elliott Wave Principle.
Elliott Wave International offers free course:
Video: The Versatility of the Wave Principle
In the video below, EWI senior analyst and trading instructor Jeffrey Kennedy shows how the Wave Principle can help you identify a high-probability trade set up regardless of the direction of the larger trend.
This timeless educational video was taken from Jeffrey’s renowned Trader’s Classroom series and is being re-released because of its valuable lesson. If a few minutes isn’t enough, get more FREE practical trading lessons from Jeffrey Kennedy in his latest eBook.


