Dow Jones Averages Definition and History
Post on: 16 Март, 2015 No Comment

How to Use the Dow Jones Averages to Predict the Stock Market
The Dow Jones Averages are stock market indices that represent the U.S. economy in three sectors: industry, transportation and utilities. The editors of The Wall Street Journal select companies which they feel best represent all companies within these three sectors. Basically, the averages are calculated by adding up the stock prices of all companies in each index, and dividing it by the number of companies. There are certain adjustments made to account for stock splits and other special considerations.
Unfortunately, the Dow Averages don’t take into account the number of shares outstanding. A company with a $200 share price will have more influence on the Dow than a company with more shares, but only a $10 price. For this reason, many investors follow the S&P 500 instead. However, both indices tend to be highly correlated. which means they move together.
The Dow Jones Indices
There are three indices, which measure three different industries. These indices are:
- The Dow Jones Industrial Average (DJIA), which tracks the share price of 30 companies which best represent their industries. The market capitalization of these stocks account for nearly one quarter of the total U.S. market. It is the most quoted market indicator in the world.
- The Dow Jones Utility Average, which tracks 15 utility stocks. Since utility companies are big borrowers, their profits are enhanced by low interest rates. Therefore, the Utility Average declines when investors are expecting increases in interest rates, making it a leading indicator .
- The Dow Jones Transportation Average, which tracks airline, trucking and shipping companies. It is a lagging indicator. which means it can be used to confirm the trend set by the Dow Jones Industrial Average. This is because transportation companies can only make their profits after the product has been manufactured and is available to ship. If the DJIA increases, but the Transportation Average doesn’t, then that may mean that demand has fallen for those companies’ products, and they aren’t being shipped.
History of the Dow Jones Averages
The creator of the Dow Jones Averages was Charles Dow, the editor of the Wall Street Journal and founder of Dow Jones and Company. On February 16th, 1885, he began publishing a list of twelve stocks — two industrial companies and ten railroads. By 1889, he expanded it eight more industrial companies. This list later became the Dow Jones Transportation Average. which included air freight and other forms of transportation. The Dow Jones Industrial Average was created on May 26, 1896, and consisted of primarily commodity -based companies. Its value was 40.94, which means the average stock price of the twelve stocks was $40.94.
Here’s the first 12 DJIA stocks. and what’s happened to them.
- American Cotton Oil became part of Best Foods
- American Sugar turned into Amstar Holdings
- American Tobacco broken up by 1911 antitrust action
- Chicago Gas now part of People Energy
- Distilling & Cattle Feeding turned into Millennium Chemical
- General Electric still in DJIA
- Laclede Gas still in business, but dropped from Dow in 1899
- National Lead now NL Industries, removed from Dow in 1916
- North American utility broken up in 1940s
- Tennessee Coal & Iron bought by U.S. Steel in 1907
- U.S. Leather Pfd. dissolved in 1952
- U.S. Rubber now part of Michelin
The Dow closed above 100 on January 12, 1906. The DJIA was increased to 20 companies in 1916, and 30 companies by 1928 — right in time for the Crash of 1929 .
Significant Dow Highs
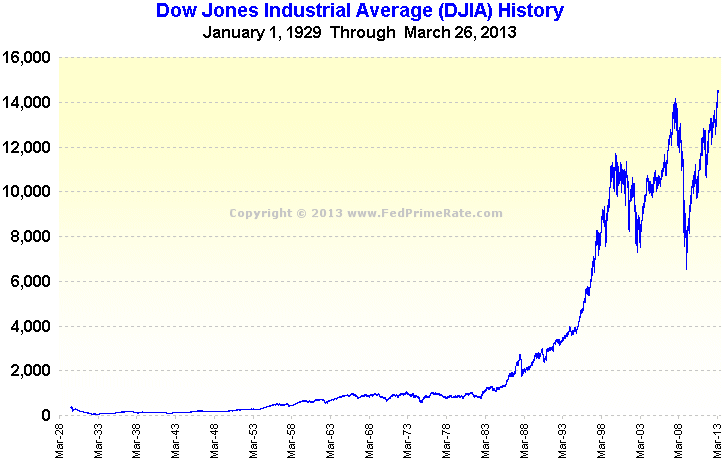
The Dow closed above 100 on January 12, 1906. Thanks to the Great Depression. the Dow didn’t reach its next landmark of 500 until March 12, 1956. It took 16 years for the Dow to double to 1,000 (November 14, 1972), and another 15 years to double again. Despite the 1987 stock market crash. the Dow doubled again in just eight year, reaching 4,000 on February 23, 1995. The Dow reached its next milestone, 10,000, on March 29, 1999 — shortly before the recession of 2001. (Source: Finfacts )
The Dow reached 14,164.43 on October 9, 2007. It plummeted 80% to 6,594.44 on March 5, 2009. It didn’t regain its pre-recession high until March 11, 2013, when it hit 14,254.38. For the most recent high, see Dow Jones Closing History. Article updated March 6, 2015.


