Double Bottom Chart Patterns
Post on: 4 Июнь, 2015 No Comment

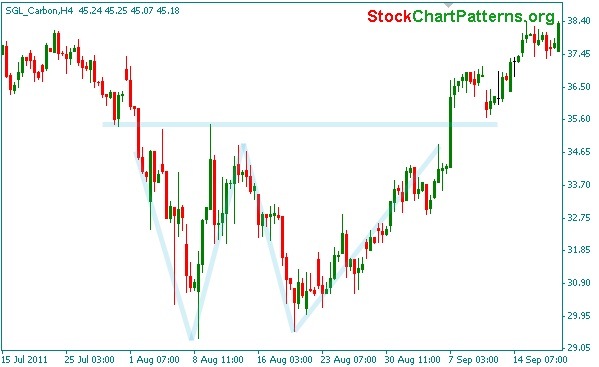
Whereas double tops are all about distribution, the double bottom is about accumulation. After an extended decline characterized by aggressive short-selling and valuation concerns, value-oriented investors with longer-term time horizons begin to take positions in the stock. They understand that the only way to build a large position in a stock that they like is to do so when selling predominates. It is their willingness to buy the stock when all of the news is bad that creates a clear support level, the first bottom (bottom#1). This first part of the pattern will normally be sufficient to force many professional short sellers (bears) to cover positions. This coupled with buying from longer-term value investors may be enough to rejuvenate investors that recently purchased the stock at higher levels — they may even rationalize that the market is finally beginning to realize that the current weakness is without merit a few bullish speculators may be enticed to take new long positions. Unfortunately, after several sessions of positive price action buying pressures are exhausted and the stock once again begins to falter. The reaction to the decline that formed bottom#1 is complete. Technical traders call this the reaction high. Sensing easy profits, short sellers return and bullish speculators decide to take profits, modest selling becomes a route. As the stock approaches bottom#1 volume remains light and in many cases the stock will actually fall through the previous low on very light volume.
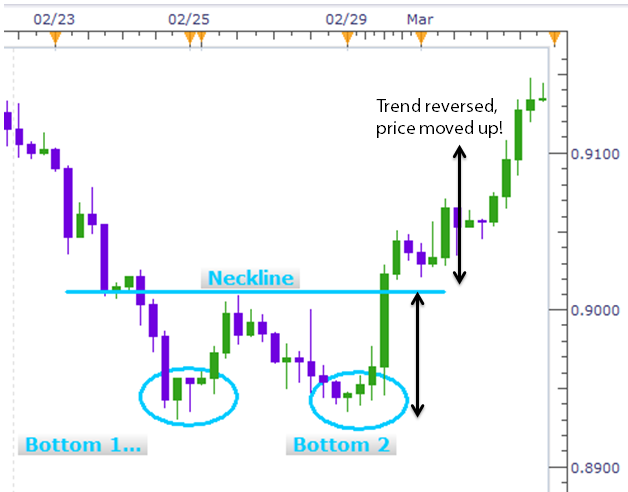
It is at this point in time that pessimism is greatest, there seems to be no legitimate reason to continue holding the stock. Novice short sellers add new short positions and beleaguered bulls who purchased the stock at much higher levels begin to surrender in anticipation of a new leg lower. However the expected big decline never materializes, selling pressures have been exhausted and this is when professional short sellers realize the jig is up. It is the new buying by bearish investors to cover short positions to capture profits and the continued accumulation by longer-term investors that helps the stock stabilize. As a second bottom (bottom#2) begins to take shape the pace of short covering accelerates and a new group of bullish speculators take long positions, the rally explodes. On the chart two equal bottoms are created, the double bottom is in place. In many cases double bottoms lead to important rallies because a vital support level has been established.
How are Technical Targets Derived?
The technical target for a double bottom formation is derived by adding the difference between bottom # 1 and the reaction high to the new breakout level. After the second bottom has been created, the new breakout level is the reaction high. No double bottom formation is complete until the stock rallies through this level.
The Double Bottom for Mercury Interactive
When momentum stocks wreck it is not pretty. That was certainly the case for Mercury Interactive (MERQ). After a parabolic rally that saw the stock reach $160 in October of 2000 the stock fell all the way to $35 by March 12, 2001. That date is March is important because it was then the double bottom pattern for Mercury Interactive began to take shape. Despite a myriad of bad news, Mercury Interactive stopped going down on March 12, 2001 and put-in bottom#1. In fact, the stock rallied to a reaction high at $51.68 by March 27 only to fall all the way back to test the March 12 lows a week later. When Mercury Interactive fell through the previous support level at $35 on April 4 there seemed to be few compelling reasons to own the stock — then the most peculiar thing occurred. Despite several Wall Street analyst downgrades the stock began to move higher on increased volume. Indeed, volume surged to better than 8.9 million shares on that session and the share price slowly began to climb. On April 17 the stock surged through the reaction high at $51.68 and that is when the real fun began. Before the start of May Mercury Interactive had achieved its technical objective.
Vital Signs
For double bottoms volume must increase as the stock moves toward the first and second bottoms. In many cases, volume will actually be higher at the first bottom because this is where value-oriented investors first take positions.
No double bottom pattern is truly valid until the stock moves through the reaction high.

Upside breakouts through the reaction high often lead to small 2-3% advances followed by an immediate test of the breakout level. If the stock closes below this level (now support) for any reason the pattern becomes invalid.
Technical targets are implied but they are by no means assured. Targets are guideposts only.
We have now completed our analysis of the double top and bottom patterns. Now let’s move-on to the three part patterns, the triple top and bottom .
double top triple top


