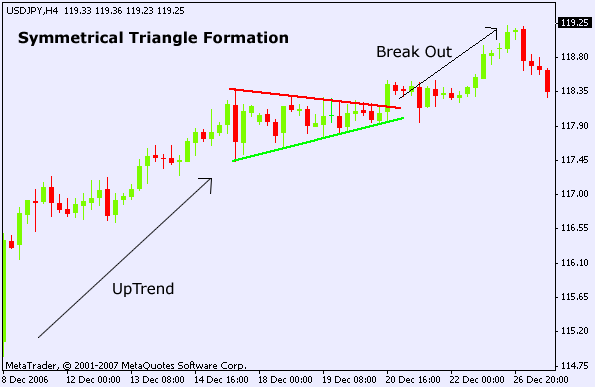
Continuation triangles
Post on: 27 Апрель, 2015 No Comment

A triangle is forming. Is it an inversion or continuation model?
«Sometimes your best investments are the ones you don’t make»
Contents
The battle between buyers and sellers
The battle between buyers and sellers isn’t regular as in triple top, in triple bottom or in inversion rectangle, here the bullish and bearish powers squeezes their volatility as time passes, until there is the explosion in a direction.
The triangle will sooner or later be broken, but they are both inversion and continuation formations, which means that when a trader see a triangle, this can make the prices rise or descend, the trend may either continue or reverse.
This is an element that apparently obscure the formation’s brightness, but, for the academics, about the 60-70% of triangles are inversion patterns (Cfr. R. Beckman, Powertiming, Probus, Chicago, 1992, pag. 171) as they appear in the inversion point of the long-term trends.
This is true, anyway the difference must be found in the temporal extension and the size of the pattern, often, in fact, an extended triangle either in extension and in size is an inversion triangle, while a small one is a continuation pattern. Moreover, this consideration must be done for every technical pattern.
Another clue to spot the direction of the breakout is given by the observation of other stocks, especially if they are the peers of the observed stock. In fact the development of other eventual inversion formations gives us other clues about the hypothetical breakout direction.
All this being said, is it worth to anticipate the signal once a triangle is spotted? Generally it’s not worth as a disciplined trader must always wait for the breakout of the pattern. He never has to anticipate the presumed bullish or bearish implications.
At least not with to the total amount of money dedicated to the trade.
Different triangle types
The difference between inversion and continuation formation isn’t the only complicated feature of this patter. The pattern may have two possible shapes:
Triangoli simmetrici e rettangoli di continuazione a confronto.  
In both triangles prices comes from a well defined trend, with a high volumes’ level and very high volatility, a clear excess that must be absorbed. So the first part of the triangle is created, a correction that ends very soon, giving life to a new reaction unable to create new highs.
The triangle continues its formation with high volumes on the beginning and after that volume becomes lower and lower (in particular on continuation triangles). The difference between the symmetrical triangles from the right-angled ones is the reached level in the second reaction.
The symmetrical triangles has the lines differently inclined: one positively, one negatively. In the right-angled triangle one of the two lines is horizontal.
This is an important difference because, in that last case, the inclination gives precious information about the possible price direction, when the breakout occurs.
There are ascending right-angled triangle (flat upper line and lower line positively inclined ) and descending right-angled triangle (negatively inclined upper and flat lower line).
The right angled triangles normally have their evolution toward the flat side, but it’s not a golden rule. There are cases when the breakout happen in the opposite and unexpected direction, forming a double top (bottom) or a rectangle.
The breakout point
An essential element to evaluate triangles is the breakout point of the pattern that, as reliable, must occur between the half and the 3/4 of its development, measured from the first peak to the hypothetical apex. The breakout must also happen with increasing volumes. If that does not happen there is a false signal and, in that case, it is unsafe to take a position in the market or, if it is done, it should be done with a thigh stop loss.
It is not uncommon that prices in the triangles, once the breakout is happen, have a pullback on the broken line. These movement must occur with volumes that are lower than the ones that there were during the breakout. If this happen this is normally a good entry point.
If instead the pull-back is formed with high volumes and the breakout happen with just few volumes, the signal is rather dangerous either for those who took position in the market and for those waiting for the pullback.
Anyway, when a pullback is formed and prices touch the external border of the pattern, prices must quickly resume the direction of the breakout with growing volumes even if, in the downwards breakouts, the presence of high volumes is a less important condition.
Possible targets
The target’s calculation is the same all types of triangle. It must be done projecting from the breakout point the pattern’s range, calculated from the first peak to the first reaction point (In the exemplified graphic is the R1 point)


