CBOE CBOE S&P 500 Implied Correlation Indexes
Post on: 23 Июнь, 2015 No Comment

The CBOE S&P 500 Implied Correlation Indexes
The CBOE S&P 500 Implied Correlation Indexes are the first widely disseminated, market-based estimate of the average correlation of the stocks that comprise the S&P 500 Index (SPX).
Using SPX options prices, together with the prices of options on the 50 largest stocks in the S&P 500 Index, the CBOE S&P 500 Implied Correlation Indexes offers insight into the relative cost of SPX options compared to the price of options on individual stocks that comprise the S&P 500.
Ticker symbols are ICJ, JCJ and KCJ are rotated as time elapses. For example, as of December 2014:
- ICJ
- Jan 2016 maturity S&P 500 implied correlation
- Calculated using Jan 2016 equity options and Dec 2015 SPX options
- Quotation is suspended after the Nov 2015 SPX expiration

The CBOE S&P 500 Implied Correlation Indexes may be used to provide trading signals for a strategy known as volatility dispersion (or correlation) trading. For example, a long volatility dispersion trade is characterized by selling at-the-money index option straddles and purchasing at-the-money straddles in options on index components. One interpretation of this strategy is that when implied correlation is high, index option premiums are rich relative to single-stock options. Therefore, it may be profitable to sell the rich index options and buy the relatively inexpensive equity options.
One of the perceived benefits of owning a portfolio of stocks is diversification related to the correlation between stocks. While less correlation between stocks in a portfolio typically leads to greater diversification, the correlation between stocks is constantly changing, and in times of market stress the correlation increases as stock prices tend to move together. As a result, the diversification benefits of a portfolio of stocks may be less than initially anticipated.
— Joe Levin, CBOE Vice President of Research and Product Development
About the CBOE S&P 500 Implied Correlation Indexes
The CBOE S&P 500 Implied Correlation Indexes measure changes in the relative premium between index options and single-stock options. A single stock’s volatility level is driven by factors that are different from what drives the volatility of an Index (which is a basket of stocks). The implied volatility of a single-stock option simply reflects the market’s expectation of the future volatility of that stock’s price returns. Similarly, the implied volatility of an index option reflects the market’s expectation of the future volatility of that index’s price returns. However, index volatility is driven by a combination of two factors: the individual volatilities of index components and the correlation of index component price returns.
Intuitively, one would expect that the implied volatility of an index option would rise with a corresponding change in the implied volatilities of options on the index components. Yet, there are times when index option implied volatility moves and there is no corresponding shift in implied volatilities of options on those components. This outcome is due to the market’s changing views on correlation. The relationship between the implied volatilities of options on an index and the implied volatilities of a weighted portfolio of options on the components of that index, therefore, becomes a measure of the market’s expectation of the future correlation of the index components — the implied correlation of the index.
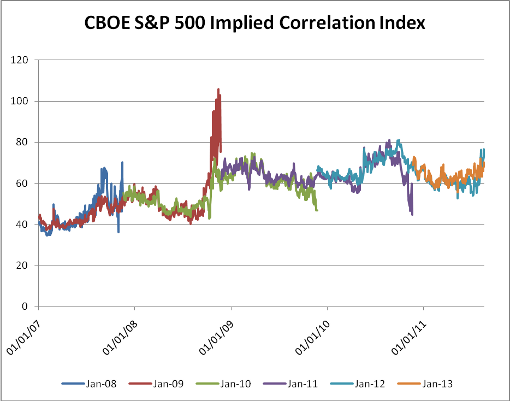
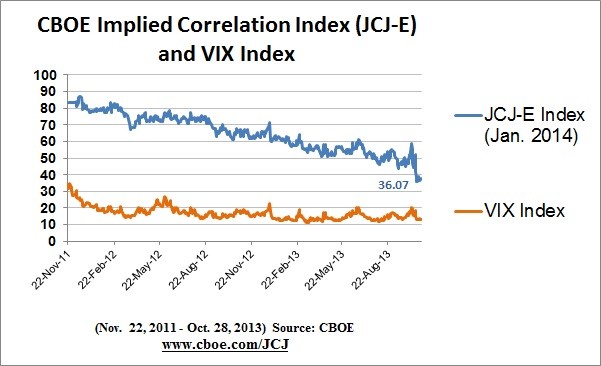
For example, from November 20, 2008, through May 29, 2009, the closing value of ICJ ranged from a low of 56.54 on November 21, 2008, to a high of 74.78 on March 20, 2009. During the same time period, the CBOE Volatility Index (VIX) declined significantly from a record-high close of 80.86 on November 20, 2008 to around 40 in mid-March and 29 at the end of May. Conversely, ICJ remained relatively high with a closing value of 58.94 recorded on June 30, 2009, possibly signaling an expectation that equity prices would continue to move together.


