Catch Trends With HeikenAshi Candlestick Analysis Trading Setups Review
Post on: 25 Май, 2015 No Comment

Candlestick patterns give reversal signals that are effective when you combine them with other analysis. However, there are dozens of candlestick patterns and more than half of them are exotic patterns that rarely occur.
Is there a more effective way to trade candlestick patterns?
Yes. Heiken-Ashi candlestick chart.
A Heiken-Ashi candlestick chart is a unique tool that offers a different perspective of price action. (Learn: Chart Types without a Time Base )
Heiken-Ashi Formula
Heiken-Ashi (HA) charts are candlestick charts derived from standard candlestick charts. These are the formula for Heiken-Ashi bars.
- HA Close = Average of Open, High, Low, Close
- HA Open = Mid-point of previous HA bar
- HA High = Highest of High, HA Close, HA Open
- HA Low = Lowest of Low, HA Close, HA Open
As you see from the formula above, we build Heiken-Ashi candlesticks with both current and past price data. Hence, it produces a smoothing effect like that of a moving average. It evens out small price fluctuations to highlight price trends.
While the smoothing effect of a moving average depends on its look-back period, the Heiken-Ashi chart does not need the trader to enter a look-back period and offers a more consistent result.
Heiken-Ashi Candlestick Chart Examples
The chart below is the standard chart for candlestick analysis.
The chart below shows the same instrument over the same time period with Heiken-Ashi overlay.
If you are looking at a Heiken-Ashi chart for the first time, you might come close to thinking that it is the Holy Grail you are searching for. With such smooth and wavy price action, it is easy to find trends and profit from them.
That is true, only if Heiken-Ashi charts show true prices. But they do not.
Despite being plotted in the form of candlesticks, you must remember that Heiken-Ashi charts do not represent current prices we can buy and sell at.
Essentially, we derive Heiken-Ashi charts from price. They are more like trading indicators than price charts.
Heiken-Ashi Candlestick Analysis
Analyzing Heiken-Ashi bars is straightforward. Lets learn by example using the daily chart of Walmart (WMT).
- When prices are trending up, Heiken-Ashi bars have no lower shadow.
- When prices are trending down, Heiken-Ashi bars have no upper shadow.
- Doji-like bars with both lower and upper shadows are possible turning points.
- The doji bars also appear in price congestion.

Find Market Turning Points with Heiken-Ashi Candlestick Analysis
Trading reversals with Heiken-Ashi charts is a two-step process.
First, find dojis on a Heiken-Ashi chart. We have already done this by marking out the dojis on the Walmart chart above. The dojis highlight areas of possible reversal or continuation where we can find trading opportunities.
Next, refer to the standard candlestick chart and look for reversal candlestick patterns.
This is the same WMT daily chart. We have circled the candlestick patterns in the Heiken-Ashi doji zones.
- There was a Morning Star candlestick pattern here. It is a bullish three-bar reversal candlestick pattern.
- After the bullish swing that filled the earlier price gap, Heiken-Ashi dojis coincided with the Three Black Crows pattern. This bearish candlestick pattern led to the down swing which ended with a double bottom.
- Walmart is filled with stars. In the other two trading zones, we found Morning Stars patterns that continued the bullish trend.
This trading approach is not foolproof. Look at the first Morning Star candlestick pattern at the bottom of the chart. The two bars before it formed a Dark Cloud Cover pattern which is bearish. Taking that signal to go short will result in a losing trade.
However, Heiken-Ashi charts are really useful for quickly identifying areas of interest for further candlestick analysis.
Let your Profits run with Heiken-Ashi Analysis
Do you have a problem letting your profits run? Do you watch over each trade with your eagle eye? Do you feel stressed by each tick of price change?
If you answered yes to any of the questions, Heiken-Ashi chart is the solution.
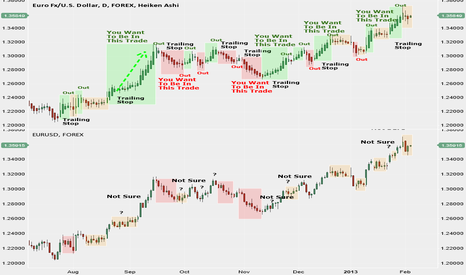
Lets take a look at a simple method of exiting with Heiken-Ashi chart. When a Heiken-Ashi bar that goes against our trade appears, we exit.
This chart marks out the exit points for long trades and short trades using this straightforward method. If you had applied the same exit method using a standard candlestick chart, you would have exited with smaller profits.
Hardly any reason not to let your profits run. Right?
Conclusion: Power of Heiken-Ashi Charts
Heiken-Ashi charts are powerful additions to your candlestick trading arsenal.
They point the way to hot trading zones for further candlestick analysis.
They help to cut your anxiety as you let profits run.
They do not need any user inputs. No more testing for the ideal moving average look-back period.
- The Modified Heikin Ashi Fibonacci Trading System
- Day Trading with Heikin Ashi Charts (Day and swing trading of stocks)
- Simple Heiken-Ashi Trading Strategy


