Cash Allocations And Volatility In A LongTerm Bull Market
Post on: 31 Май, 2015 No Comment

Summary
- Volatile markets lead investors to question how much they should allocate to cash, but the answer is far less complex than the problem.
- How your portfolio allocations affect performance in today’s market conditions.
- Volatility in the market looking forward.
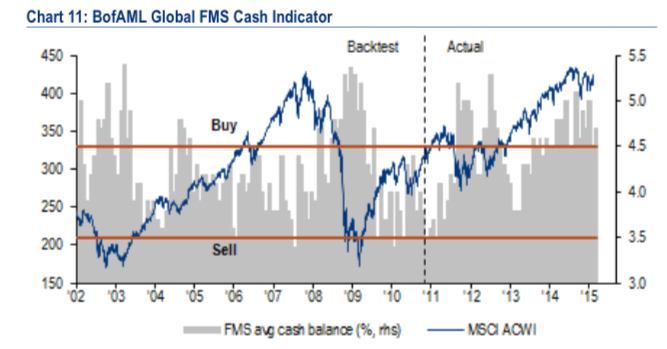
Current market conditions might lead investors to second guess how much the ‘right’ amount of cash is for a portfolio. Many would argue that we’re currently in a long-term bull market (I would agree), so naturally cash reserves should be low in order to capture the potential for capital appreciation. However, when weeks like 1/15/15-1/23/15, where the Dow broke 17,800, and 12/9/14-12/16/14, where the Dow lost close to 5% down to 17,000 are less than a month apart, there’s no wonder why some investors call for larger cash reserves in order to reduce short-term losses due to the high volatility.
Cash in a Portfolio
In order to assess how different portfolios would fare with current market conditions, I’ve made two hypothetical portfolios: 1) 55/35/10-6 (stocks/bonds/cash) and 2) 60/40 (stocks/bonds). I used a broad market ETF, the Vanguard Total Stock Market ETF (NYSEARCA:VTI ), and an aggregate bond ETF, iShares Core Total U.S. Bond Market ETF (NYSEARCA:AGG ), to build these portfolios. The reason behind two comprehensive investments is to create the most fair hypothetical performance. Performance will vary based on individual investments, but this illustrates how the most basic portfolio would fare. This isn’t an investment proposal, just a synopsis on allocation strategies.
60/40
This is the conventional 60% equities and 40% FI exposure. It’s typical for bull markets, because it has majority exposure to equities, which have the best returns during bull markets. It also has exposure to FI, which protects during downswings. During the past year, the FI exposure was crucial, due to the stagnant low interest rates. There were no reallocations, and the portfolio only followed the growth rate of VTI, plus AGG. Dividends were not reinvested.
55/35/10-6
This portfolio is meant to be adjusted on a monthly basis according to short-term fluctuations. It can have anywhere between 6%-10% cash in order to divest and reinvest before trend reversals, and to change exposure to both bull and bear trends. Dividends were not reinvested in this scenario either. In the table below, the months in red are months in which cash was reallocated to adjust for foreseen downtrends, as well as expected uptrends. Holdings in green/red have been added to or subtracted from. Notice how before most bear months, bonds weren’t divested, and for the first strong bull period, stocks were allocated higher than bonds. The reason behind this was twofold: 1) not to create unnecessary downward pressure on the other during their uptrends and 2) to maximize exposure to the current uptrend.
The boxed numbers under the YTD column are total returns for the entire year, and as you can see, the 60/40 portfolio outperformed the 55/35/10-6 portfolio by 3% without being constantly adjusted for short-term fluctuations.
So What’s the Takeaway?
A long-term bull market is called a bull market for a reason. Short-term trends aren’t usually fueled by fundamentals or valuations, and even bearish sector losses are outweighed by gains on bullish sectors. So the takeaway is this: invest with confidence and stick to your plan. If you see a holding becoming overvalued, sell and reinvest. Even if you followed the broad market, you’d end out on top. Also, don’t subscribe to a bearish outlook just because of short-term risk.
However, going forward, the market will be increasingly volatile. This will make trends harder to recognize, and lead to decreased investor confidence. To stay in the bull market, the 60/40 portfolio may be the best play going forward. It will absorb some of the short-term downswings, as well as keep you exposed to the long-term uptrend.
Market Volatility
Volatility in the markets is what investors make it. They can either ride it out, or divest and wait for smoother seas, but it seems counterintuitive to divest during a proven bull market with arguably bullish outlooks.

From the chart below, the broad market could be as high as 2.3% or as low as -1.55% on a given day. There’s not much positive or negative trend. In fact, the average daily percent return worked out to be .04% with a 0% total return. Having the broad market on a 3mo flat line is a good thing. It means that even though volatility is absurdly high, long-term gains aren’t being lost. Going forward, you as an investor need to keep this in mind. Depending on what happens with the Fed rate hike, the price of oil, and increasing global macroeconomic indicators, either side of the resistance line could be broken and lead to a stronger trend in either direction.
Contributing Factors to Market Volatility
Economic concerns
Investors are concerned about the health of economies all over the world. Globally, almost every major economy is forecasting decreased quarterly growth, lead by a lower-than-expected read on American GDP on 1/30/15. The ECB is currently increasing its bond-buying program in hopes to stimulate its economy, but currently to no avail. Eurozone debt is skyrocketing, and most investors fear that if it gets any worse, the world may be on the brink of another recession. China just implemented liquidity measures into a failing financial sector as well.
The price of oil is also a big contributor. It directly affects top-line revenue for the entire energy sector, as well as operating costs for every other sector. Now that America is producing oil on the world stage, global demand for Middle Eastern, Russian, and other minor oil producers is slashed. This ruins their government revenues, which worsens the global economic outlook, and in turn, leads to more uncertainty.
The global stage is not looking good to investors, and while some are pulling out, there is a massive tug-of-war. This happens when big daily selloffs occur, and the bulls of the market scoop up unwanted shares, which only gives the bears more uncertainty.
The Fed
Now that America is out of its QE program, a rate hike is expected. What this means for markets is that until the Fed is more clear when it will administer the rate hike, investors will stress over the timing, and make the markets more volatile. Historically, markets have reacted well to rate hikes, but that still won’t ease bearish concerns about net interest margins, debt, and its effect on the overall economy.
Summary
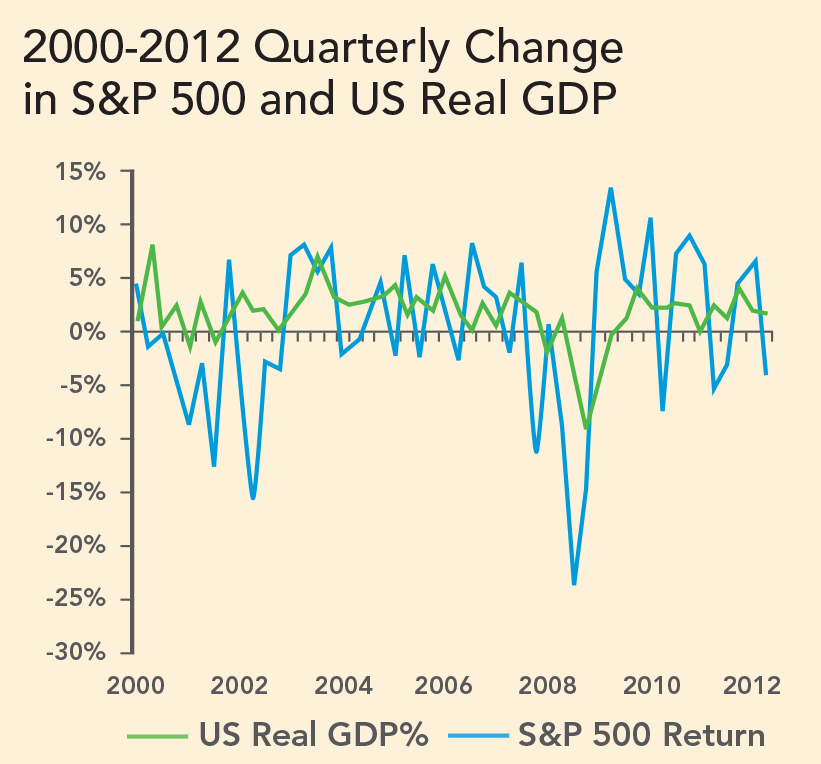
The market has been volatile all year, and there’s no question that volatility will increase as 2015 goes on, global economic problems develop, rates increase at some point, and GDP (hopefully) increases. But how does this tie into your portfolio and its allocations?
Refer to the chart below. Notice that even though the market is extremely volatile, the bears’ downward pressure has habitually given out. Yes, there are some sharp downturns, but I argue that you’ll experience those in any market. What’s important is to not lose your head and instead pay attention to the longer-term trend. On a technical standpoint, the broad market has a small downward trend, but the red highlighted periods also had the same trend. What follows them is what’s most important to consider: the large eventual increase. I’m not saying an increase is guaranteed, but I do believe that the current macroeconomic plights will eventually benefit the market.
The low price of oil will aid in decreasing overhead costs for corporations, increase discretionary spending for consumers, and ultimately help the American GDP. It’s also important to not forget that the unemployment rate is historically low, not all equity valuations are bearish, and business investments are high.
To wrap up, I argue to stay with the proven allocations. Stick with the 60/40 until a long-term trend reversal is signaled by macroeconomic indicators like oil’s effect on energy stocks, rising unemployment, falling GDP, or unsuccessful international stimulus measures. It will be tough, but there’s no sense in getting out of a long-term bull market.
Disclosure: The author has no positions in any stocks mentioned, and no plans to initiate any positions within the next 72 hours. (More. ) The author wrote this article themselves, and it expresses their own opinions. The author is not receiving compensation for it (other than from Seeking Alpha). The author has no business relationship with any company whose stock is mentioned in this article.


