CAPE Earnings Volatility And Stock Returns 18712019
Post on: 18 Апрель, 2015 No Comment

Summary
- Eliminating earnings volatility, as in Shiller’s CAPE, reduces the P/E ratio to shadowing deviations from the long-term moving average of stock prices.
- Stocks behave contra-cyclically during bull markets, becoming inversely correlated with commodities, inflation, interest rates, and earnings, but in this article, we will consider earnings volatility itself, from a few perspectives.
- Medium-term (five- to ten- year) fluctuations in stock prices seem to be partially predicted by fluctuations in earnings volatility, although it is not especially clear how or why.
- Based on an extrapolation from the historical relationship between P/E, earnings, and stocks, it appears that a stock market boom will continue until the conclusion of the decade.
Although earnings have tended to grow at a relatively constant rate over the last five or six decades, over the short run, they tend to be relatively volatile. When Shiller’s CAPE smooths out earnings, this has two effects. The obvious one is that it eliminates the short-term volatility of earnings. Less obviously, it reduces earnings to playing something like a long-term moving average of share prices. Compare, for example, CAPE with the real S&P 500 index divided by its twenty-year moving average. There is very little difference in the two, and using the deviation from the moving average has only been slightly less predictive of future returns than has CAPE. The question then inevitably arises: when earnings volatility is stripped out, how much value is being added to market analysis?
(Sources: All charts in this article come from calculations from the data graciously provided by Robert Shiller on his website ).
In my previous article. as well as in articles I wrote last year, I pointed out that bull markets are typically contra-cyclical (counter-cyclical sounds too much like monetary or fiscal policy), while bear markets are highly cyclical. That is, in a bear market, stocks (SPY ,DIA ,QQQ ) tend to be positively correlated with commodities (GSG ,DJP ,RJA ), inflation, earnings, and interest rates (UST ,IEF ), but in a bull market, stocks are negatively correlated with these factors.
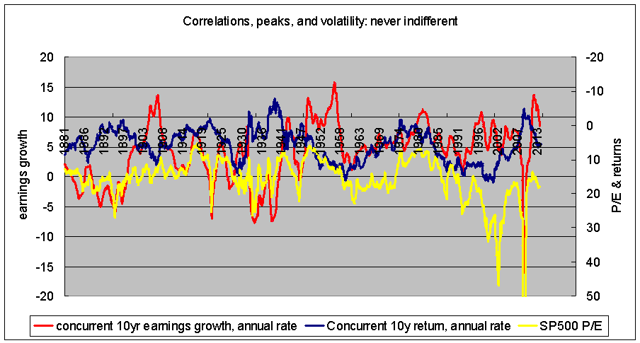
(click to enlarge) In this chart, you can see that during bull markets, annual changes in stocks become, not only disengaged from earnings, but inversely correlated with changes in earnings. (In fact, that stock prices become inversely correlated rather than merely indifferent suggests that we cannot simply attribute these rallies t o optimism as a recent headline suggested, but that is a whole different article).
The interesting thing about the current market is that it appears to have transitioned from a post-crisis bear rally (2009-2011) to a proper bull market (2011-?) in much the same way that the market did in the early 1920s. Ninety years ago, the market shifted from a bear rally in 1922-1924 to a bull market that lasted until the fall of 1929. Those transition years, 2011 and 1924, respectively, also saw the last hurrahs of a commodity boom, as well as political and economic crises abroad. The initial crises of 2009 and 1921 were also experienced as brief but very sharp earnings collapses that manifested themselves, somewhat unusually, as P/E expansions.

Shiller’s Cyclically-Adjusted Price/Earnings ratio, just like it says on the tin, denudes the P/E ratio of these cyclical distractions.
My hunch is that cycles (i.e. short-term fluctuations) contain important information about the market. The cyclical/contra-cyclical modes in the market already strongly suggest that, but in this article, I wanted to investigate two interrelated questions, one general and one specific:
1. What insights do we lose when we smooth out earnings?
2. What might earnings volatility be saying about the present market?
My answer to the first question is that, over the five- and ten-year ranges, earnings volatility seems to contain important information about future returns. And, in answer to the second question, I believe that the first answer suggests that the parallels with the 1920s are not merely coincidence: earnings volatility would seem to be indicating a strong bull market until the conclusion of the decade. In other words, there seems to be something about a temporary, severe earnings shock that reflects or creates conditions consonant with a raging bull market; that is, a bull market that exhibits all of the contra-cyclical behavior listed above.
All of these observations raise difficult questions, unfortunately. What accounts not only for contra-cyclicality but changes from contra-cyclicality to cyclicality and back? Why would the severity and brevity of an earnings shock appear to result in earnings growth in the short-term but P/E expansion in the medium? Is earnings volatility really the right way to frame the phenomenon, or is there something else going on?
Let’s not wander into those thickets quite yet, though.
P/E Ratios and Earnings Growth
Instead, let’s begin with a more basic question about CAPE and its theoretical underpinnings. Investors buy shares to gain access to future profits. Shiller points out, however, that CAPE and future returns are inversely correlated. The inverse correlation shows that investors have unrealistic expectations about future earnings growth, which is why they should be smoothing out the earnings cycle in the first place.
But, why not ask how well P/E ratios predict earnings growth, rather than just returns? After all, if fluctuations in returns are driven primarily by share price movements (which they are), then wouldn’t a negative correlation between CAPE and returns simply indicate that investors are not good at predicting share prices or that they do not care about stock prices as much as we think they do or should?
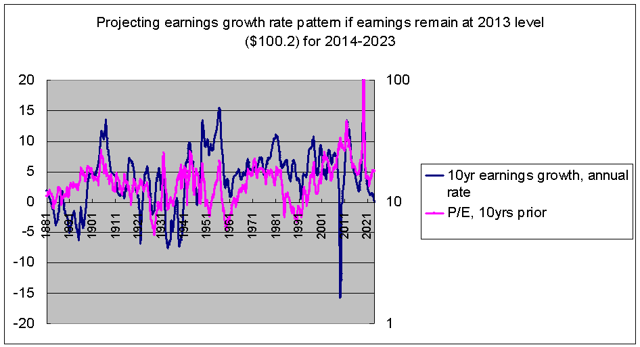
I was surprised by what I found when I ran the correlations between CAPE and raw P/E (that is, P/E calculated using concurrent earnings) against earnings and returns over three-, five-, ten-, and seventeen-year periods. (I threw the three- and seventeen-year comparisons into the mix randomly). As you can see in the table below, CAPE is negatively correlated with returns over the short-, medium-, and long-term. So is raw P/E, although the relationship is clearly weaker and less uniform. Raw P/E, however, does a fair job of predicting future earnings growth, whereas CAPE does not have any relationship with subsequent earnings.
Subsequent returns and earnings growth (1871-2013)


