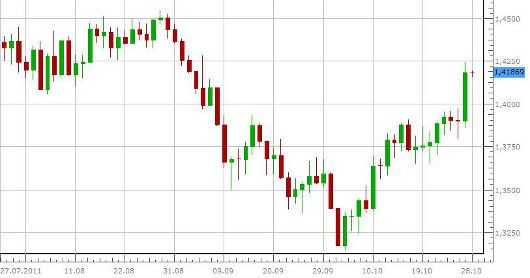
Candlestick chart
Post on: 23 Апрель, 2015 No Comment

Candlestick chart technique was introduced by the Japanese rice traders and it is considered as the ancient method used to analyze the chart movement. The reason why the candlestick chart technique still exists from 1600 is because of its predictability and accuracy in chart movement.
Honestly speaking, learning the candlestick chart analysis is not a big deal but identifying the candlestick chart patterns in the midst of other candlestick bodies is most important.
Why do you need to use the candlestick chart analysis?
- Better graphical presentation – Unlike bar charts and line charts, candlestick charts show the complete picture of the stocks’ day performance. Better the visual illustration, easier to recognize the trading opportunity
- Not to rely on indicators – Traders often use indicators like “moving average” to forecast the stock price fluctuation. But, the candlestick chart technique helps traders to make the decision easily and not to rely on too many technical indicators to execute the trade
- To identify reversals – I strongly believe that the candlestick chart is the best method to identify trend reversal earlier than other charts. Bar charts take some time to show the reversal signal but within two or three sessions the candlestick chart can show the reversal and create opportunity for traders to make decisions
Candlestick patterns like Hanging Man, Gravestone Doji, Three White Soldiers show the trend reversal earlier and traders can take advantage of it. (These pattern names sound interesting, don’t they?)
Candlestick structure and how to read it
You should be able to understand the candlestick structure by looking at the picture below. You can differentiate the candlestick body by its color. Green candlestick body signifies buyers win the day and red body indicates sellers win the day. The center body with the width called as real body and the thin line present above and below the real body is called shadow.
Shadow shows the high and low of the day. Open and closing position in the real body change is based on the Bulls/Bears performance. If it’s a Bullish day, the open position is located at the bottom & close at the top and it’s vice versa for a Bearish day


