Bull Markets in Modern Times
Post on: 16 Март, 2015 No Comment

What drives a bull market? How does it get started, and how does it end? What happens to stock fundamentals during these bullish times? There are no ironclad rules that can tell you when a bull market begins and ends, but there are some similarities that all bull markets share. Understanding the way bull markets work can help you become a better and more informed investor — and if you’re the inquisitive sort, you’re also bound to find some interesting parallels between otherwise unrelated market cycles. History may not repeat, but it often rhymes.
Here, in the last of a three-part series, you’ll find an overview of some of the most notable bull markets in the more recent history of the Dow Jones Industrial Average. Each bull market overview includes some basic background data, some of the market’s major fundamental changes during those periods, and a brief description of the economic, social, technological, financial, and political forces at work. When you’ve finished reading, don’t forget to check out the other parts of this series, as well as the companion series to this one that highlights the Dow’s many bear markets. You’ll find the links below.
1966-1968: Vietnam bounce
- Began (starting price): Oct. 7, 1966 (744.32)
- Ended (final price): Nov. 29, 1968 (985.08)
- Number of trading days: 517
- Total percentage gain and average gain per trading day: 32%, 0.06% per day
- Volatility (i.e. average daily price change): 0.48%
- CAPE, initial and final: 18.8 to 22.3 (18% increase)
This extremely shallow bull market was driven by valuation growth; real earnings declined by 3%. The continued growth of the investment industry, powered by a new generation of financial wizards, provided enough residual bullishness to return prices to a level near that of their 1966 peak.
1970-1973: Nifty 50 bubble
- Began (starting price): May 26, 1970 (631.16)
- Ended (final price): Jan. 8, 1973 (1,047.86)
- Number of trading days: 663
- Total percentage gain and average gain per trading day: 66%, 0.1% per day
- Volatility: 0.54%
- CAPE, initial and final: 13.8 to 18.7 (36% increase)
Despite President Richard Nixon’s abandonment of the gold standard in 1971, this bull market enjoyed mild inflation — the CPI grew a total of 10% over three years. Growth was driven by the Nifty 50, a group of well-capitalized companies with proven growth records and a history of dividend increases. Their perceived strength led many investors to ignore fundamental valuation concerns. Disney ( NYSE: DIS ) and McDonald’s ( NYSE: MCD ) both sported P/Es of more than 70 in 1972, higher than even the inflated Nifty 50 average P/E of 42. Regardless of temporarily inflated valuations, Disney still grew 3,300% in the ensuing four decades, while McDonald’s posted an impressive 14,800% gain over the same time frame.
1974-1976: Post-Nixon rebound
- Began (starting price): Dec. 6, 1974 (577.6)
- Ended (final price): Sept. 21, 1976 (1,014.79)
- Number of trading days: 453
- Total percentage gain and average gain per trading day: 76%, 0.17% per day
- Volatility: 0.78%
- CAPE, initial and final: 8.3 to 11.3 (37% increase)

Oil prices, though still far above their pre-embargo levels, began to decline. Gold also interrupted its steady ascent with a drop that almost perfectly matches the timing of this bull market. Many investors had been frightened off by the brutal decline of the preceding bear market, and the combination of depressed valuations and weak alternatives attracted enough bargain-seekers to produce a moderate rebound.
1978-1981: Carter’s inflation
- Began (starting price): Feb. 28, 1978 (742.12)
- Ended (final price): April 24, 1981 (1,024.05)
- Number of trading days: 779
- Total percentage gain and average gain per trading day: 38%, 0.05% per day
- Volatility: 0.68%
- CAPE, initial and final: 9 to 8.8 (1% decline)
This long, shallow bull market was driven by inflationary factors and virtually nothing else. During this period, real earnings declined by 4%, but the consumer price index increased by 42%, which is by far the largest increase experienced in any bullish period. Adjusted for inflation, the market grew only about 5%.
1982-1987: Reagan’s boom
- Began (starting price): Aug. 12, 1982 (776.92)
- Ended (final price): Aug. 25, 1987 (2,722.42)
- Number of trading days: 1,274
- Total percentage gain and average gain per trading day: 250%, 0.2% per day
- Volatility: 0.7%
- CAPE, initial and final: 6.6 to 18.3 (176% increase)
Market valuations were at their lowest level since 1921 at the beginning of this bull market as the American economy began to emerge from an inflation-driven recession. The price of oil and gold were both in free fall. The baby boom generation came of age during this period, which was marked by a shift in attitudes toward economic conservatism, deregulation, and defense-driven deficit spending. The rise of junk bonds, private equity, and leveraged buyouts provided ample fuel for a market rebound, although real marketwide earnings were slightly negative over the course of these five years.
1987-1990: The modernization
- Began (starting price): Oct. 19. 1987 (1,738.74)
- Ended (final price): July 17, 1990 (2,999.75)
- Number of trading days: 694
- Total percentage gain and average gain per trading day: 72.5%, 0.1% per day
- Volatility: 0.83%
- CAPE, initial and final: 13.6 to 17.7 (31% increase)
After a short, devastating crash that bottomed out on Black Monday in 1987, the Dow resumed its growth under many of the same principles as before. This weak interregnum between the ruthlessness of the ’80s and the wide-eyed optimism of the ’90s was tempered to a degree by the onset of the savings and loan crisis and contained some elements of each bull market that bookended it.
1990-2000: Dot-com bubble
- Began (starting price): Oct. 11, 1990 (2,365.10)
- Ended (final price): Jan. 14, 2000 (11,722.98)
- Number of trading days: 2,366
- Total percentage gain and average gain per trading day: 396%, 0.17% per day
- Volatility: 0.63%
- CAPE, initial and final: 15.2 to 43.8 (188% increase)
The end of the Soviet Union in 1991 created a unipolar world led by the U.S. At the same time, the growth of computing technologies, already well underway during the 1980s, took off in the 1990s. Less than 1% of the American populace was online in 1990. A decade later, 43% of Americans had gotten online, either via America Online and one of its gazillion free trial discs or through one of an increasing number of service providers, all of which experienced enormous investor interest if they proved even marginally competent. Networking specialist Cisco ( NASDAQ: CSCO ) is a perfect example of the excitement surrounding tech stocks in this period. From its 1990 IPO to the market’s peak, Cisco’s shares provided investors with returns of 100,600% .
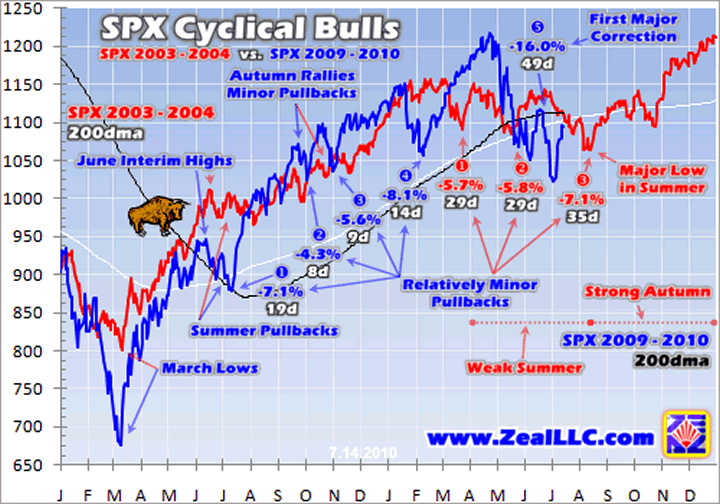
2002-2007: Subprime bubble
- Began (starting price): Oct. 9, 2002 (7,286.27)
- Ended (final price): Oct. 9, 2007 (14,164.53)
- Number of trading days: 1,258
- Total percentage gain and average gain per trading day: 94%, 0.08% per day
- Volatility: 0.61%
- CAPE, initial and final: 22.0 to 27.3 (24% increase)
This bull market was driven by the twin trends of emerging-market development and financial-industry shenanigans, particularly in the housing and mortgage sector. Chinese indexes reached all-time highs toward the end of this period, and a number of Chinese companies entered the American stock market to great acclaim, often through controversial reverse mergers. Investors were thrilled at the prospect of investing in China and its enormous potential. Mortgages were handed out en masse to Americans of all stripes, with millions refinancing their homes as values increased dramatically across the country. Leverage and debt became the instruments of prosperity during this period.
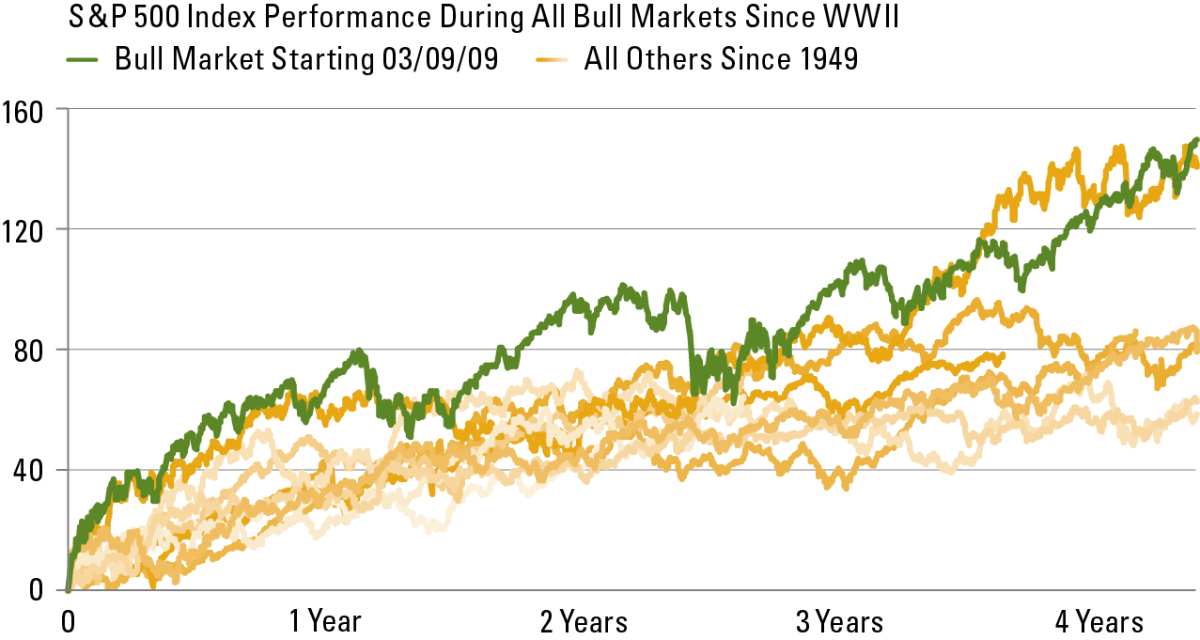
2009-present (current to Feb. 7, 2013): Obama’s rebound
- Began (starting price): March 9, 2009 (6,547.05)
- Ended (final price): ongoing (13,944.05)
- Number of trading days: 988
- Total percentage gain and average gain per trading day: 113%, 0.11% per day
- Volatility: 0.78%
- CAPE, initial and final: 13.3 to 22.8( 71% increase)
A weak recovery from a devastating financial crisis brought on by excessive leverage? Sounds a lot like the 1930s. Just as the Roosevelt administration used bold, persistent experimentation in an effort to stabilize a shattered economy, the Obama administration, with the help of an eager-to-ease Federal Reserve, has tried to spur the economy in various ways — at least, as best as Congress has allowed. A debt-ceiling standoff in 2011 came dangerously close to causing a new bear market, but last-minute agreements saved the Dow from further declines. Although this bull market has been much maligned in the financial press, it has already produced more growth than all but eight other bull markets on this list.
Putting it all together
The times, they were a-changing. The period we discussed began with the hippie protests against Vietnam and ended with former hippies wondering whether their dot-com-era portfolios would ever be attainable again. The American stock market became increasingly international, both through the globalization of American businesses and through the offerings of many foreign companies. Marketwide valuations reached their highest levels in history, and they still remain elevated beyond historical norms. This period also saw the rise of computerized trading, which now performs millions of high-frequency transactions in the blink of an eye, without any human intervention. What comes next? No one knows. The length of our current bull market might be another week, another year, or another decade.
Want to learn more? Read about the modern bear markets that created today’s market, or go back to the beginning and see what you missed in the history of the Dow’s bull markets:
Want to learn more about market cycles? You can find the rest of the series here:
AUTHOR’S NOTE. the cyclically adjusted P/E referenced throughout is compiled by Yale economist Robert Shiller from a historical S&P 500 composite. The Dow is used in place of this composite because it offers precise daily closing dates and prices, rather than the monthly results used in Shiller’s calculations. The difference between these two indexes from the Dow’s creation in 1896, on an inflation-adjusted basis, is less than 3%. CAPE numbers are from the nearest month to a given bull market’s beginning and end.
Whether you’re anticipating a bear market or expecting a long bull run ahead, you can find some of the market’s best stocks in our Foolish list of Nine Rock-Solid Dividend Stocks . Like the Nifty 50 of the ’60s and ’70s, these Nifty Nine are stable and well-run, with a long history of growing dividend payments. No matter where the market goes, you’ll be well-prepared for the future if you invest in these stocks. Click here for the information you need — it’s completely free .
Fool contributor Alex Planes holds no financial position in any company mentioned here. Add him on Google+ or follow him on Twitter @TMFBiggles for more insight into markets, history, and technology.
The Motley Fool recommends Cisco Systems, McDonald’s, and Walt Disney. The Motley Fool owns shares of McDonald’s and Walt Disney. Try any of our Foolish newsletter services free for 30 days. We Fools may not all hold the same opinions, but we all believe that considering a diverse range of insights makes us better investors. The Motley Fool has a disclosure policy .


