Bear Market Rally
Post on: 1 Май, 2015 No Comment

Current Position of the Market
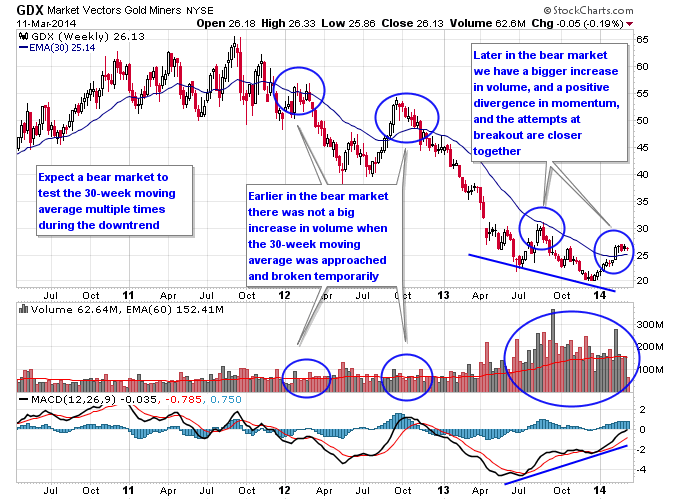
SPX: Long-term trend Down! The very-long-term cycles have taken over and if they make their lows when expected, the bear market which started in October 2007 should continue until 2012-2014. This would imply that much lower prices lie ahead.
SPX: Intermediate trend Sideways! The counter-trend rally which started on March 6 is undergoing a consolidation which could last two or three more weeks, after which the bear market rally will continue.
The rally which started on March 6 is turning out to be much stronger than most had expected. Not only did the SPX go up uninterrupted for over two months and 263 points, but we cant even get a decent correction after all this! Last Friday, the index closed only 11 points from its high and, by closing on its high of the day, looks ready to go higher. Well, dont get fooled by looks. Its more than likely that the correction is not over, and the next couple of weeks will be down. After that, the bear market rally will continue and find a more decent top which will bring about a real correction or, to be more exact, will bring about the return of the bear market and a new SPX low.
On Friday, the NDX made a new recovery high, which would also seem to intimate that we are ready to extend the rally. The problem is that the internals were not supportive of the move, and that neither the Russell nor the Value line appear ready to follow. Now, if we should explode upward on Monday morning, I will be ready to change my mind, but until I see some more evidence that we are ready to go forward, I think its more probable that we will retrace.
Other signs of market readiness that we look for, such as the sentiment indicator, is still more bearish than bullish, and the daily momentum indicators are not making a convincing buy pattern. Conclusion: more consolidation is ahead.
More often than not, lows tend to coincide with an important cycle making its low. There are none directly ahead. Those that could have brought the market down and that were mentioned repeatedly in the past few weeks are now behind us after disappointing the bears, and with the possibility that at least one or two may have inverted. There are only a couple of short-term cycles bottoming in mid-June. They could be the ones that will end this consolidation. Lets keep June 16 and 17 in mind.
Whats ahead?
Chart Pattern and Momentum
The two brown lines represent a secondary trend channel. The index is consolidating under the top trend line and will probably go through it after the consolidation is over. This will not signal that we are in a new bull market. The primary trend channel is much higher around 1200 and I sincerely doubt that the rally from 667 will continue long enough to come even close to it.
Since I expect Fridays move to have reached its peak at the close, or early on Monday, I have made certain assumptions about the end of the consolidation which I have noted on the chart. These assumptions would be invalidated if Fridays move continued and closed higher than 925 on an hourly basis. There are several other factors which could nullify or modify that scenario, even if we found a top at 919.
Both oscillators are close enough to give a buy signal so I think that we wont have long to wait and should know by Mondays close whether or not we have a buy signal or if additional consolidation is needed.
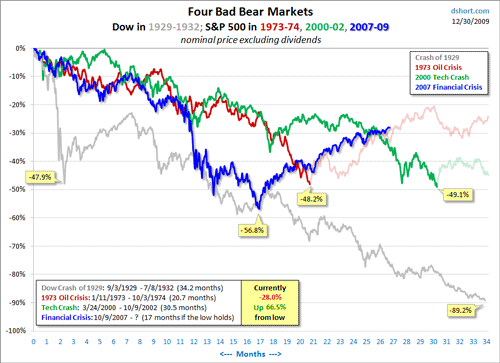
We left off yesterday, sitting on the edge of our seats: Is the bear market rallythe suckers rallyover? After a major fall in prices, theres nothing more reliable than a bounce. And then, the bounce reliably gives way to another, harder fall.
Not that were looking forward to seeing poor Humpty Dumpty fall off the wall again. We just like to see things turn out they way theyre supposed to. Humpty has it coming.
The Dow fell 184 points on Wednesday. Maybe it marked the turning point. Maybe Mr. Market figures hes lured in enough suckers. With stocks up 9 weeks in a rowand investors with a 37% gainthis would be a fairly typical bear trap.
Stocks are not cheap. There is no reason to buy them unless you think the economy will improve, raising corporate profits. How likely is that? Well it depends on what you think is going on. If you think this is just a pause in an otherwise-healthy economythen, you might believe that things will pick up. Thats whats happened after every recession since 1948. The average one lasted only about 10 monthswith about a 2% decline in GDP. By those yardsticks, this one ought to be over.
But if you believe that this is something more than a typical Post-WWII recession, thenwatch out. The Great Depression lasted for nearly 4 yearstaking 27% out of the GDP. And then, when it looked as though it was over, along came another downward whack in 1937 that lasted another 13 months.
And just look at what is going on in Japan. There, theyve had an on-again, off-again recession since 1990. Investors who bought into the rebounds any time in the last 19 years were subsequently disappointed. Each time Japanese stocks rallied, they soon fell again. Now, they are going up along with the rest of the worlds stocks. But theyre still down about 70% from the 1989 high.
Yesterday, the Dow managed a weak rebound. It gained 46 points. Oil and the dollar stayed where they were. Gold rose to $928.
As near as we can tell, everything is coming to pass as expected: Consumers are cutting back. Stocks are bouncing. The economy is weakening. And the government is making things worse.
After 25 years of recklessly spending, borrowing, and going deeper and deeper in debt, Americans are coming to their senses. Theyre cutting back. Theyre determined to stop being the bagman for the entire globalized world economy.
Since the early 1980s, begins a report in the Economist. spending by households on goods, services and homes has grown faster than GDP, making it the locomotive of American and global expansion. By 2006 it accounted for 76% of nominal GDP, the highest since quarterly data began in 1974.
This was accompanied by a steady decline in the personal saving rate and a rise in household debt relative to income. By itself, this was not a problem; household debt has risen relative to income since the 1950s, as a growing share of the population has taken out mortgages. Despite the higher debt burden, falling interest rates kept total household financial obligations interest payments, rent and leases within a range during the 1980s and 1990s.
An inflection-point occurred around 2000. Income growth stagnated but debts continued to grow rapidly, from 94% of income to 133% in 2007
But that was when house prices were rising and credit was easy to get. This year is different, the Economist tells us. The credit card industry sent out only one quarter as many solicitations for new credit card customers as it did last year. And now, with house prices fallingand the financial industry running for coverconsumers no longer have shovels to dig themselves deeper holes of debt; instead, they have to stop spending so much money.
The Economist estimates that consumers need to shuck $3 trillion worth of excess mortgage debt, alone, in order to get back to year-2000 levels. If all US savings were put to the task, even that would take 4 or 5 years at the present rate. Adding debt is always a lot faster than paying it off, explains colleague Simone Wapler.
But the year 2000 was a year with very low real interest ratesand it came at the end of a 20-year period of credit expansion, not at the beginning of one. As real interest rise in the next long cycle of credit contraction, consumers are likely to want to erase debt down to, say, a 1990 or even a 1980 level, which would require paying off trillions more.
Expecting them to stop at the year 2000 is wishful thinking. Its like expecting this bear market to take stock prices to go back to their year-2000 level, rather than to a level more in keeping with a real bottom. Or expecting to become only a little bit wrinkledand no more
This process, known as de-leveraging, requires consumption to grow more slowly than income in coming years, notes the Economist .
Incomes are actually falling. Not surprising, consumption is falling too:

(Reuters) Sales at U.S. retailers fell for a second straight month in April as cash-strapped consumers held back on purchases, government data showed on Wednesday, denting hopes the economy would soon emerge from recession.
The Commerce Department said retail sales slipped 0.4 percent after falling 1.3 percent in March.
Sales dropped despite an increase in the disposable income of some households due to tax cuts and cash transfers linked to the governments record $787 billion stimulus package.
Analysts said U.S. householders, whose wealth has been decimated by plunges in house and stock prices, likely decided to save the extra income or pay off debt instead of spending it. Economists had expected sales to be flat
Consumers still havent decided to start spending money and the economy is still in a funk. Folks are very focused on non-discretionary items, buying staples, and people are trying to deleverage themselves, said Bob Duffy, leader of global advisory firm FTIs Retail Practice.
Naturally, if consumers dont buy, theres no need to restock the shelvesand if you dont have to restock the shelves you dont have to call for a delivery. All goods need to be moved from one place to another. Thats why economists keep an eye on the trucking industry. If the trucks arent rolling, the economy isnt either.
Dow Theory maintains that you only have a reliable stock market signal when the main index is confirmed by a movement in the transportation index. In other words, if the trucking and shipping companies dont confirm an up-tick, the movement of the broader market may be a feint or a fluke.
So how are the teamsters doing?
If youre hoping to hear that the downturn is ending, dont ask questions at a truck stop. In the first quarter of this year, 480 trucking companies went out of business. Last year, the total was 3,000 companiesrepresenting 7% of all the nations trucks. The more the economy contracts, the more trucks get run off the highway. Eventually, the number of trucks still on the roads is sufficient, but not excessive, for the volume of goods they have to move. Until that happens, the slump continues!
This is not just another recessionary pause, in other words. This is a depression. And depressions bring changes, not just a rest. The trucking industry needs to adjust to the new levels of consumer spending. That means fewer big rigs on the road.
In this case, the truckers tell all.
The auto industry needs to adjust too. In todays paper is more discussion of Detroits efforts to break its contracts with its franchise dealers. Chrysler has 800 franchises its trying to get rid of. GM has 1,000. The contracts need to be renegotiated. Employees need to be let go. The car lots need to be abandoned or re-built for other uses. All this takes time.
Meanwhile, the latest jobless numbers are higher than forecast.
Bill Bonner
for The Daily Reckoning Australia


