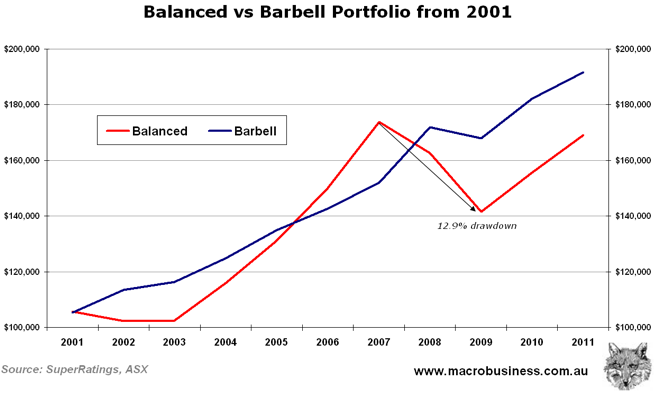
Barbell strategy funds outperform
Post on: 27 Август, 2015 No Comment

25 Jun 2001 | 01:00
Funds in the UK Equity Income sector using a barbell strategy have been able to post above average r.
Funds in the UK Equity Income sector using a barbell strategy have been able to post above average returns and not at the expense of increased volatility.
The two top performing funds in the UK equity income sector have both delivered strong outperformance of their peers while maintaining a significantly lower than average beta.
ABN Amro’s Equity Income, managed by George Luckraft since 1993, has returned 91.21% over the three years to the end of May 2001, compared to a sector average of 14.58% for the same time period. Luckraft has been able to deliver the best returns and still maintain the second lowest beta in the sector, 0.58% versus an average of 1%.
Similarly, the Rathbone Income fund, managed by Carl Stick, has outperformed the sector average by 35.73% over the three years to end May 2001, returning 50.31%. Stick has achieved this growth with a beta of just 0.76%.
Given the two funds high risk adjusted returns, both have easily outperformed the sector in terms of annualised alpha, with Luckraft delivering 22.04% and Stick 11.41%, compared to a sector average of 0.35%.
Luckraft puts his strong outperformance and high risk-related returns down to stockpicking and a flexible approach to investing.
Luckraft is a pioneer of the barbell strategy, investing in both growth and income stocks, with a core holding of at least a third of the fund invested in FTSE 100 stocks to facilitate liquidity and mitigate volatility in the fund.
‘We have been running with a barbell approach with both growth and income in the fund. The market has been swinging between the two and that has actually reduced volatility,’ Luckraft said.
The fund does not specifically target low beta performance and does invest in individual high beta stocks, but taken as a whole the fund has a surprisingly low volatility rating, Luckraft noted.
‘A large chunk of the income shares are smaller companies and the volatility is low there,’ he added.
The fund is currently skewed toward income stocks because of the difficulty in finding quality growth stocks at attractive valuations.
Luckraft has reduced his cash weightings from an average of 7% over the past six to 12 months to a 3.5% weighting, in anticipation of a market rally in the third quarter.
Luckraft has increased the number of holdings in the fund from 75 to 81, over the course of the year in a bid to diversify the portfolio further, but will look to reduce this number as the market starts to pick up.
He remains defensive in the near term, however and has upped his weightings in utilities.
‘Utility yields are attractive and the scope for shocks is minimal,’ he explained.
AWG is one stock in the sector Luckraft is favouring, believing it will benefit from an increasingly positive regulatory background.
He has also tentatively started to add to his position in BT, but remains wary and heavily underweight the company relative to the index.
The Hargreaves Lansdown Optimum Income and Growth fund has been managed by Stuart Louden since the start of 1999. The fund has returned 36.58% over the three year period to end of May 2001, compared to the sector average of 14.58%. The fund has a below average beta of 0.86% and an above average annualised alpha of 7.7%.
In the discrete period of June 1999 to the end of May 2000, the fund returned 20.42%, compared to a sector average of 3.73% for the same period and was only outperformed by Luckraft’s Equity Income fund. Over the year to end of May 2001, HL Optimum Income and Growth returned 11.26%, compared to a sector average of 6.75%.
Louden said the basket of stocks he inherited needed to be almost completely replaced, due to the lack of performance and undesirable risk related return profile of the portfolio in January 1999.
Throughout 1999, Louden also adopted a barbell strategy, investing in growth, income and FTSE 100 stocks.
The fund is still run along similar lines but with a less extreme split between the three focal areas, as growth becomes more difficult to find.
The portfolio is primarily focused on small and medium-sized companies, as Louden said it is difficult to find attractive valuations in the FTSE 100 at the moment.
‘I look for mispriced companies, but there has to be a catalyst within six to 12 months for that to change. I am struggling to find mispriced companies in the FTSE 100,’ he noted.
Louden likes to run a fairly concentrated portfolio but is flexible, which he believes helps the fund to maintain an above average risk related return.
‘I have 60 stocks at the moment, which is probably on the high side. In the long term I will reduce this to a pretty concentrated 45-50 stocks,’ he said.
Louden said this will enable all holdings to total at least 2%, adding that he believes smaller holdings add little value.
He is currently overweight in financials, both from a growth and value perspective. As a value play, Louden invested 5% of the fund in Integrated Lloyd’s Vehicles, which had fallen over 60% from its peak. Louden believed ILV offered value at this level, adding that the market was looking back rather than forward.
As a growth play, Louden is upbeat about Provident Financials.
He said: ‘Provident Financial is expanding overseas and it is going exceptionally well. It is yielding 4-5% and the yield is growing and earnings are showing double digit growth.’
The Liontrust First Income fund, managed by Jeremy Lang, has consistently delivered above average returns, while also maintaining a below average beta.
First Income has returned 26.78% over the three years to end of May this year, outperforming the sector average by 12.2%.

Lang puts the fund’s consistent outperformance down to stockpicking and seeking out stocks that consistently yield more than long-dated gilts.
The fund primarily invests in recovery stocks, which offer high yields and growth potential.
‘I tend to up pick stocks when the market has valued them down. It is a question of timing, exploiting the market’s pessimism,’ Lang said. The fund has a beta of 0.87%, compared to the sector average of 1%. Lang said the volatility of the fund is purely a by-product of his stock selection, rather than any concerted effort to minimise beta.
‘I invest in companies where the share price has stopped reacting to bad news and the volatility almost decouples from the stock price,’ Lang noted.
The low portfolio turnover style he operates also reduces volatility.
Lang said he will typically hold on to a stock for at least a year and often for between three to five years, until the yield drops off.
Lang said he is not a thematic investor and sector weightings are purely a consequence of where the best yielding companies can be found. A number of his current holdings are in defensive markets such as food and drug retailers, although he has a number of holdings in engineering companies, particularly those with exposure to the oil industry.
‘I have no holdings in telecoms or media and only one tech company,’ Lang added.
Glossary
Regression analysis: Regression statistics can be used to compare the relationships between funds, markets or a specific benchmark index. They do not make the assumption that the variables (funds) are related as cause and effect, but permit them to be influenced by other variables (markets).
Alpha: The Alpha describes the theoretical reward obtained by one investment when the second investment has a zero return. To calculate the Alpha, the returns of each are taken and compared together to identify their relationship. This reveals relationships between investments in both bull and bear markets. When applied to portfolios, it can be considered to be the return over and above (or below) the market through portfolio strategy. Good managers have a positive Alpha.
Beta: The Beta is the amount the first fund moves when the other moves by one unit. Beta is a measure of relative volatility (absolute volatility is calculated by standard deviation).
If one fund always goes up and down by 1.5 times of the performance of the index, its Beta will be 1.5. This implies that if the return of the index is positive, then 1.5 times this positive return can be expected of the fund. If the index goes up (or down) 10%, the fund goes up (or down) 15%. Beta represents the volatility of the first investment versus the second. It is only an estimate and to be accurate there has to be a perfect correlation between the two investments.
Correlation: Correlation shows the strength of a linear relationship between two funds. A perfect correlation is when the investments behave in exactly the same manner. A perfect positive correlation is represented by 1, perfect negative correlation by -1 and no correlation with a 0. A perfect negative correlation suggests that for every 1% movement by the index we would expect to see -1% movement return on the fund and vice versa. This is an important factor when using modern portfolio theory.
R-squared: The R-squared indicates the level of movement that can be ascribed or determined by the movement of an index. When the R-squared equals 1 there is a perfect correlation between the investments ‘ 100% of the movement in a fund can be determined by the movement in the index. When the R-squared equals 0, there is no correlation between the investments. An R-squared between 0.7 and 0.99 suggests that between 70% to 99% of the movement in our fund could be explained by the movement in the index. Below 0.3, there is effectively no influence.
Monthly volatility (or standard deviation): Standard deviation is a measure of absolute volatility. It is the measure of the square root of the variance of each monthly return from the mean. The larger the figure, the higher the volatility of a fund and thus its risk. A typical example of the kind of funds and their associated risk ranging from low risk to high risk are: cash funds, fixed interest funds, balanced funds, UK equity funds, overseas equity funds and warrant funds.
Source: Standard & Poor’s


