ASSET CLASS CORRELATIONS
Post on: 13 Апрель, 2015 No Comment

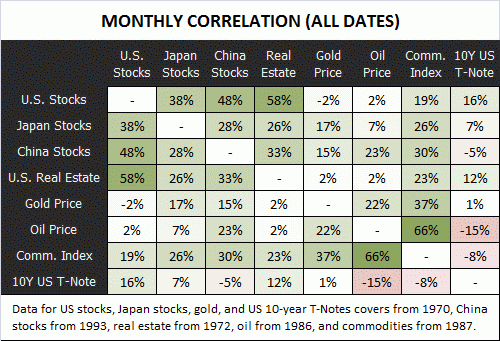
Diversifying across asset classes (otherwise known as asset allocation) is the foundation on which prudent, long-term successful investment strategies are built. One of the essential issues for allocating among the various asset classes is carefully choosing those pieces that will offer the most diversification bang for the buck, and then weighting the asset accordingly. Modern portfolio theory advises that there are three primary variables that feed into this decision: volatility of returns, expected returns for each asset, and the correlation of returns among the assets.
Focusing on the latter for the moment reveals several interesting trends for the strategically minded investor. (Well be publishing more on correlations going forward, but for the moment heres a taste of what were tracking.) Lets start with the classic stock/bond mix, for which we crunched the data based on rolling 36-month trailing correlations for monthly total returns between the Russell 3000 and the Lehman Aggregate Bond Index, plotted monthly, starting in January 2001 and running through last month.
As the chart below reveals, the sharply negative correlation that defined equities and fixed-income in recent years is giving way to something less. To be sure, stocks and bonds still post slightly negative correlation, and so the diversification factor remains potent for owning both asset classes. But if the trend in recent years keeps up, investors may want to re-examine diversification expectations for the classic stock/bond mix. (Note: 1.0 indicates perfect correlation, 0 is no correlation, and -1.0 is perfect negative correlation).
Meanwhile, the correlation trend in domestic/foreign stocks has been improving, although only marginally so. In fact, the diversification value of domestic/foreign equities has been of relatively limited value in recent years, as the chart below shows. Thanks to globalization and enhanced liquidity across borders, the Russell 3000 and the MSCI EAFE ($) returns correlation has been high in recent years. Ditto for U.S. stocks and emerging markets equities, as tracked by MSCI EM ($). Is that high correlation status in the process of changing? Perhaps, as the fall in correlation between the two indices of late suggests (see chart below). If the trend continues, allocating a greater portion of assets to foreign stocks may be warranted in the future. Stay tuned.
If theres hope for the domestic/foreign equity mix as a diversification tool, something less inhabits the realm of large- and small-cap domestic stock blends. Or so the trend of late indicates. As the chart below illustrates, the correlation of monthly returns between the Russell 1000 and Russell 2000 indices (large- and small-cap proxies, respectively) has been on the rise. In fact, the correlation between large- and small-caps has been fairly lofty in recent years, and that status doesnt show any sign of changing. As a result, the diversification benefit of owning large and small equities within the U.S. has been uninspiring.
The correlation between monthly returns for REITs and U.S. stocks is on the rise too. The low correlations of 2002 have been fading for some time. Although REITs still have roughly a 0.5 correlation (based on the Wilshire REIT and Russell 3000), the diversification effect has sharply diminished in recent years.
If nothing else, the above charts remind that while finding low and negatively correlated assets is essential for building a diversified portfolio, the definition of what constitutes low and negative is always evolving.


