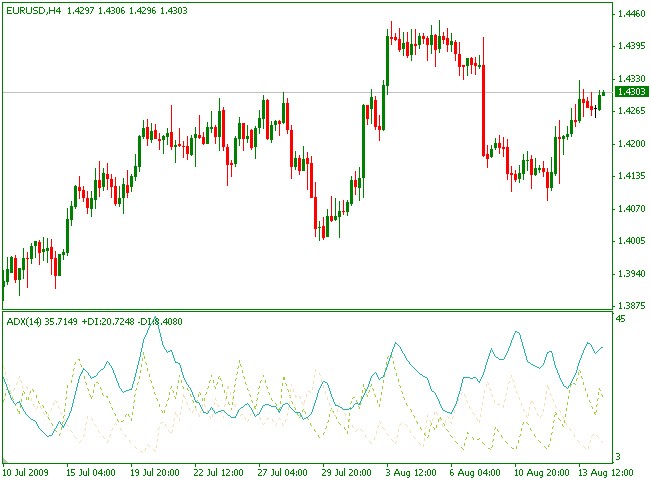
ADX Average Directional Movement Index
Post on: 9 Апрель, 2015 No Comment

What is ADX(Average Directional Movement Index) indicator, the instructions of ADX and how to use the ADX indicator, the calculation of ADX indicator and the ADX indicator main paramete
Description
Average Directional Movement Index Technical Indicator (ADX) helps to determine if there is a price trend. It was developed and described in detail by Welles Wilder in his book New concepts in technical trading systems.
The simplest trading method based on the system of directional movement implies comparison of two direction indicators: the 14-period +DI one and the 14-period -DI. To do this, one either puts the charts of indicators one on top of the other, or +DI is subtracted from -DI. W. Wilder recommends buying when +DI is higher than -DI, and selling when +DI sinks lower than -DI.
To these simple commercial rules Wells Wilder added a rule of points of extremum. It is used to eliminate false signals and decrease the number of deals. According to the principle of points of extremum, the point of extremum is the point when +DI and -DI cross each other. If +DI raises higher than -DI, this point will be the maximum price of the day when they cross. If +DI is lower than -DI, this point will be the minimum price of the day they cross.
The point of extremum is used then as the market entry level. Thus, after the signal to buy (+DI is higher than -DI) one must wait till the price has exceeded the point of extremum, and only then buy. However, if the price fails to exceed the level of the point of extremum, one should retain the short position.
The Average Directional Index (ADX), Minus Directional Indicator (-DI) and Plus Directional Indicator (+DI) represent a group of directional movement indicators that form a trading system developed by Welles Wilder. Wilder designed ADX with commodities and daily prices in mind, but these indicators can also be applied to stocks. The Average Directional Index (ADX) measures trend strength without regard to trend direction. The other two indicators, Plus Directional Indicator (+DI) and Minus Directional Indicator (-DI), complement ADX by defining trend direction. Used together, chartists can determine both the direction and strength of the trend.
Directional Movement
Plus Directional Movement (+DI) and Minus Directional Movement (-DI) form the backbone of the Average Directional Index (ADX). Wilder determined directional movement by comparing the difference between two consecutive lows with the difference between the highs.
Directional movement is positive (plus) when the current high minus the prior high is greater than the prior low minus the current low. This so-called Plus Directional Movement (+DM) then equals the current high minus the prior high, provided it is positive. A negative value would simply be entered as zero.
Directional movement is negative (minus) when the prior low minus the current low is greater than the current high minus the prior high. This so-called Minus Directional Movement (-DM) equals the prior low minus the current low, provided it is positive. A negative value would simply be entered as zero.
The chart above shows four calculation examples for directional movement. The first pairing shows a big positive difference between the highs for a strong Plus Directional Movement (+DM). The second pairing shows an outside day with Minus Directional Movement (-DM) getting the edge. The third pairing shows a big difference between the lows for a strong Minus Directional Movement (-DM). The final pairing shows an inside day, which amounts to no directional movement (zero). Both Plus Directional Movement (+DM) and Minus Directional Movement (-DM) are negative and cancel out each other. Negative values revert to zero. All inside days will have zero directional movement.
Calculation
Where:
- N — the number of periods used in the calculation.
Interpretation
The Average Directional Index (ADX) is used to measure the strength or weakness of a trend, not the actual direction. Directional movement is defined by +DI and -DI. In general, the bulls have the edge when +DI is greater than DI, while the bears have the edge when DI is greater. Crosses of these directional indicators can be combined with ADX for a complete trading system.
Trend Strength
At its most basic the Average Directional Index (ADX) can be used to determine if a security is trending or not. This determination helps traders choose between a trend following system or a non-trend following system. Wilder suggests that a strong trend is present when ADX is above 25 and no trend is present when below 20. There appears to be a gray zone between 20 and 25. As noted above, chartists may need to adjust the settings to increase sensitivity and signals. ADX also has a fair amount of lag because of all the smoothing techniques. Many technical analysts use 20 as the key level for ADX.


