Adaptive Asset Allocation A True Revolution in Portfolio Management
Post on: 30 Июнь, 2015 No Comment

The magnitude of this error in assumptions cannot be overstated because long-term averages hide enormous variability over shorter periods which can be observed and utilized for better portfolio assembly.
Consider the following chart, which shows the range of real returns to U.S. stocks over rolling 20-year periods from 1871 through 2009. While 20 years or so approximates a typical retirement investment horizon, it exceeds, by multiples, the average psychological horizon of most investors which is much closer to 3 or 4 years.
Source: Shiller, Butler|Philbrick|Gordillo & Associates
You will note that, even over horizons as long as 20 years, annualized real returns to stocks range from -0.22% right before the Great Depression crash, to 13.61% during the 20 years ending in March of 2000.
For portfolios created using traditional Strategic Asset Allocation, this amount of variability in returns means the difference between living on food stamps after 10 years of retirement and leaving a deca-million dollar legacy for heirs. In other words, a retirement constructed using long-term average return estimates is analogous to a game of retirement Russian Roulette, where luck alone decides your fate.
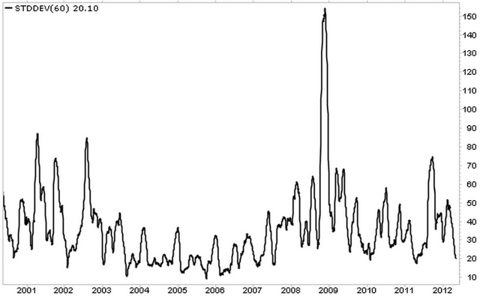
There is a great deal going on under the surface with volatility estimates too. For example, while long-term daily average volatility is around 20% annualized for stocks, and 7% for 10-year Treasury bonds, the following two charts show how realized volatility fluctuates dramatically over time for both stocks and bonds.
S&P 500 60-Day Rolling Standard Deviation (Index points)
10-Year Treasury 60-Day Rolling Standard Deviation (Index points)
Source: Stockcharts.com
Incredibly, you can see that the volatility of a bond portfolio can fluctuate by over 1000% over a 60 day period, and the volatility of a U.S. stock portfolio can fluctuate by almost 1500% .
This has a dramatic impact on the risk profile of a typical balanced portfolio, and therefore on the experience of a typical balanced investor. Most investors believe that if a portfolio is divided 60% into stocks and 40% into bonds, that these asset classes contribute the same proportion of risk to the portfolio.
However, as the next chart shows, for a portfolio consisting of 60% S&P500 and 40% 10-year Treasuries, the stock portion of the portfolio actually contributes over 80% of total portfolio volatility on average, and over 90% of portfolio volatility about 5% of the time. In late 2008 for example, a 60/40 portfolio generally behaved as though it was over 90% stocks!
Garbage long-term average estimates in: garbage portfolio results out.
Source: Yahoo Finance, Butler|Philbrick|Gordillo & Associates Strategies
GIGO: Correlation
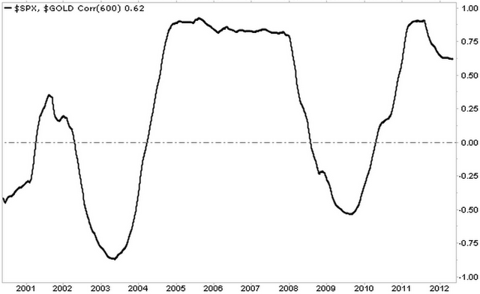
By now it probably comes as no surprise that the correlation between asset classes fluctuates substantially over time as well. While the long-term correlation between U.S. stocks and Treasuries, and U.S. stocks and gold, are low or even negative over the long-term, the actual realized correlation between these assets oscillates between strong and weak over time.
Source: Stockcharts.com
From the charts, notice that the long-term average 60-day rolling correlation between stocks and Treasuries over the 12-year period shown is -0.42, and the correlation between stocks and gold is +0.22.
However, the stock/Treasury correlation varies between -0.82 and +0.27 over the period, and the stock/gold correlation varies between -0.84 and +0.91. You could fly a 747 through those ranges, and the current correlation has an enormous impact on portfolio volatility.
Source: Butler|Philbrick|Gordillo & Associates
In fact, as you can see from the chart above, the volatility of a 50/50 stock/bond portfolio increases by 100% as correlation increases from -0.8 to +0.2. holding all else constant.
Garbage long-term average estimates in: garbage portfolio results out.
Return, volatility and diversification estimates vary widely from their long-term averages over the short and intermediate terms. Managers who do not monitor and adjust portfolios to these changes risk substantial deviation from stated portfolio objectives, and are almost certain to deliver a sub-optimal experience for investors.
The Objective of Portfolio Optimization
One of the most important axioms in finance is that the best estimate of tomorrows value is todays value. Our prior articles in this series clearly demonstrate this important concept for returns. volatility and correlation .
Which begs the question: If we can measure the value of these variables over the recent past, and they are better estimates over the near-term than long-term average values, why dont we use current observed values for portfolio optimization instead? Why would we choose to hold a static asset allocation in portfolios when it is possible to adapt over time based on observed current conditions?
It is worth noting that the overall objective of asset allocation is to deliver the highest returns per unit of volatility. In finance, this is called the Sharpe ratio*.

You may wonder why we dont we just focus on returns. Well, one reason is that higher risk portfolios are much more difficult to stick with. While we may know logically that stocks deliver reasonable long-term returns, we may find it difficult to ride out sustained losses of 50%, 60% or greater on the way to our promised long-term growth. Under such circumstances most of us will cry Uncle at the wrong time and permanently harvest a large loss.
Thats why in our examples below we also highlight a measure called maximum drawdown, which describes the maximum peak-to-trough daily loss of each portfolio over the period under investigation. Between volatility and maximum drawdown we capture a substantial portion of meaningful risk.
For those in or near retirement. when evaluating the tests below remember that higher returns alone will not improve retirement income or sustainability. For retirees drawing income, or those within 5 years of retiring, the most important measure of portfolio performance is the returns/volatility ratio: the higher this ratio, the higher the sustainable retirement income from a portfolio.
Introducing Adaptive Asset Allocation
To illustrate the revolutionary advantage that accrues from using recent observed portfolio parameters to regularly adapt portfolios to changing market conditions, consider a portfolio consisting of 10 major global asset classes:
- U.S. stocks
- European stocks
- Japanese stocks
- Emerging market stocks
- U.S. REITs
- International REITs
- U.S. intermediate Treasuries
- U.S. long-term Treasuries
- Commodities
- Gold
Going back to 1995, if we held this basket of assets in equal weight, and rebalanced monthly, we would have experienced the following portfolio growth profile [Example 1].
Example 1: 10 Assets, Equal Weight Rebalanced Monthly
We saw above in GIGO: Volatility above how volatile assets like stocks dominate the total risk of a typical portfolio, and the chart above provides further proof. But what happens if we observe the actual volatility of each asset in the portfolio over the past 60 days, and adjust the allocations at each monthly rebalance period so that each asset contributes the same 1% daily volatility to the portfolio, to a maximum of 100% exposure [Example 2]?
Source: Yahoo finance, Butler|Philbrick|Gordillo & Associates
By simply sizing each asset in the portfolio so that it contributes the same 1% daily volatility based on observed volatility over the prior 60 days, the return delivered per unit of risk (Sharpe) almost doubles from 0.66 to 1.23 versus the equal-weight portfolio, and the maximum drawdown is cut in half from 44% to under 20%.
Now lets re-introduce momentum as a better return estimate. We demonstrated how assets that have risen the most over the prior 6 to 12 months tend to continue to outperform over subsequent weeks. Momentum is therefore just a better way of estimating performance over the near-term future. So lets consider a new portfolio assembled monthly from the top 5 assets out of the 10 asset basket above, based on their performance over the past 6 months. This will be our pure Momentum Portfolio [Example 3].
Example 3: 10 Assets, Top 5 Equal Weight By 6-Month Momentum, Rebalanced Monthly


