A Rosy Future For Berkshire Hathaway Berkshire Hathaway Inc (NYSE BRK A)
Post on: 22 Апрель, 2015 No Comment

Summary
- Negative press on Berkshire Hathaway misinformed.
- Recent disappointing returns due to peculiar Berkshire business model.
- Long term Berkshire shareholders likely to enjoy double-digit returns.
This is in response to the recent negative press appearing on several news sources about Berkshire Hathaway: it is interesting to see how detractors hurry in criticizing the company during its rare spells of underperformance. This actually reminds me of the negative press on Warren Buffett that was prevalent in the late ’90s, criticizing him for not embracing the technology boom and missing out on the returns. Clearly, WB was eventually proven right in 2000, when the .com bubble collapsed and Berkshire continued to shine.
Let’s see the facts this time. Between 1965 and 2013 Berkshire Hathaway has generated compounded returns of 19.7%, beating the S&P index by almost 10% per year. As most negative articles correctly point out, Berkshire’ performance has shined a little less during the last five years, underperforming the S&P by a total of approximately 20%. However, most detractors fall short of identifying the reasons behind these apparently disappointing returns, but often use this occurrence to reinforce the idea that investors should avoid active managers and stick to index funds: if not even Warren Buffett manages to consistently beat the market at times, then what are your odds through the average portfolio manager?
While possibly well-intentioned, similar theses are inherently flawed and do not render an accurate picture of the situation. It is my intention to rectify this and give the readers an idea as to what future returns can be expected from a Berkshire investment today and, consequently, whether active managers can ever represent a good bet for the average investor.
Understanding Berkshire Hathaway’s Revenue Generation Model
When analyzing the performance of Berkshire, most people do not use its stock price, but rather the company’s increase in book value per share. This is important for two reasons: first, because the price performance of Berkshire stock in the last five years has performed almost as well as the S&P 500 ( increasing about 113% vs. 125%). Second, because using book value as a performance meter, while being a good idea for the medium/long term, might be deceiving if used as a short term indicator vis-à-vis the S&P 500. As a matter of fact, Buffett himself chose that metric as a proxy for long-term increases in Berkshire’s intrinsic value precisely because changes in stock price might be deceiving in the short term. To understand why this is so, it is crucial to identify how Berkshire appears to have generated market-beating returns in the first place.
In May 2012, three researchers from Yale University (Frazzini, Kabiller and Pedersen) published Buffett’s Alpha, an insightful paper attempting to pinpoint the sources of Berkshire’s outstanding long term returns. The authors identified various factors including: focusing on low volatility (beta), defensive stocks; buying when valuations are low (e.g. during times of pervasive pessimism) and using inexpensive leverage derived from Berkshire’s insurance float and, to a lesser extent, from the emission of extremely low interest bonds (Berkshire was rated AAA for most of its history). Essentially, Berkshire has been borrowing at 2% and reinvesting in businesses generating 14% with an effective leverage of around 160%.
The concept in Buffett’s Alpha is relatively simple. Low volatility, defensive stocks (e.g. Coca Cola, J&J, etc.) paradoxically tend to outperform the rest of the stock market as they are typically shunned by active managers who seek higher volatility stocks in their quest for higher returns. Because they are unappealing to the market as whole, they are often cheaper and hence more remunerative if held for the long haul. Numerous empirical studies confirm that buying cheap, conservative stocks, tends to generate 3/5% of excess returns relative to the rest of the market.

The market generates about 10% of annual returns on average and Buffett’s focus on cheap, defensive stocks enable a compounded annual growth rate of around 14%. Critically, low-beta stocks are by definition less volatile and, therefore, can withstand moderate amounts of leverage. So, with borrowing costs at 2% and assets generating 14%, Berkshire enjoys a 12% spread that, leveraged at 160%, translates into a total return of 19.2%: very close to Berkshire’s observed long term performance of 19.7%. This explains neatly how Buffett achieved a seemingly stunning long term performance, but does not yet tell us why returns and alpha, returns in excess of the benchmark, appear to have slowed down lately.
Sources of recent underperformance
The conventional wisdom blames size for Berkshire’s shrinking generation of excess returns. While this may be true, it only explains part of the story. The idea is simple: with only a few million dollars of assets, an individual has the entire universe of over 5,000 stocks listed in major US markets (not to mention minor exchanges and foreign stocks) available to cherry pick the most attractive bargains. Berkshire, on the other hand, has almost half a trillion dollars to invest: naturally its available universe is almost exclusively limited to a limited number of blue chip stocks. This insight probably explains why Buffett’s performance has been gradually shrinking from as much as 50% per annum during his early partnership years, to the more modest returns achieved in the last decade. There is more.
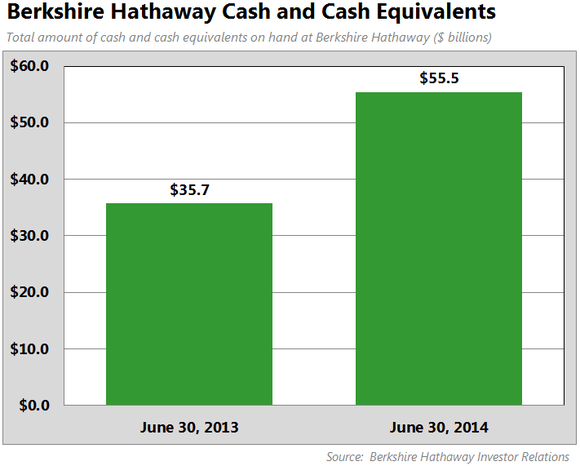
Over time, Berkshire has been decreasing its relative holdings of common stocks, which now represent only about a quarter of the company’s total assets. The remaining 75% includes mostly private businesses, bonds and cash. Both marketable securities and private businesses enjoy excess returns through the leverage dynamics we described earlier, but their gains do not impact Berkshire’s book value in the same way.
Only Berkshire’s common stocks holdings are sensitive to market fluctuations, while fixed income and private businesses generate the same amount of cash flow regardless of market movements: this situation has the effect of stabilizing Berkshire’s changes of book value over time. When markets rise, Berkshire’s stock holdings rise proportionally, but increases in book value are held back by the relative stability of bonds and private businesses. When markets fall, however, Berkshire’s common stocks fall, but book value benefits from the cash flows generated by private businesses and bonds. The result is that book value necessarily rises faster, on a relative basis, during falling stock markets and slower during bull markets. This effect has been amplified lately as the ratio of common stocks to private businesses at Berkshire has been steadily decreasing.
CONCLUSION
Berkshire increases in book value over the last five years have indeed lagged the S&P 500 by about 20%. However, the period in question has been characterized by rapidly increasing markets almost every single year, exactly the situation where we would expect Berkshire to perform less well on a relative basis. When markets do slow down however, as they always do, I would expect Berkshire to come roaring back and Buffett’s alpha to return with a vengeance.
The negative press recently appearing on Berkshire typically leaves out one critical piece of information: Berkshire’s performance in the most recent down year, 2008. In 2008, Berkshire has outperformed the S&P by a staggering 27.4. Now if that is not alpha, I don’t know what else is.
The author is the Managing Partner of Quintessential Capital, an investment fund based in New York.
Disclosure: I am long BRK.A, BRK.B. I wrote this article myself, and it expresses my own opinions. I am not receiving compensation for it (other than from Seeking Alpha). I have no business relationship with any company whose stock is mentioned in this article.
Since you’ve shown interest in BRK.A, you may also be interested in


